County-Level Distress Index
Financial distress scores for every U.S. county. Each of the 3,144 counties is scored 0–100 across five domains: debt and delinquency, income and poverty, housing cost burden, employment and wages, and community vulnerability.
Data: Census, BLS, Urban Institute, HUD, US Courts | Scores as of 2026-03-17
National Snapshot
County Distress Map
Loading interactive map…
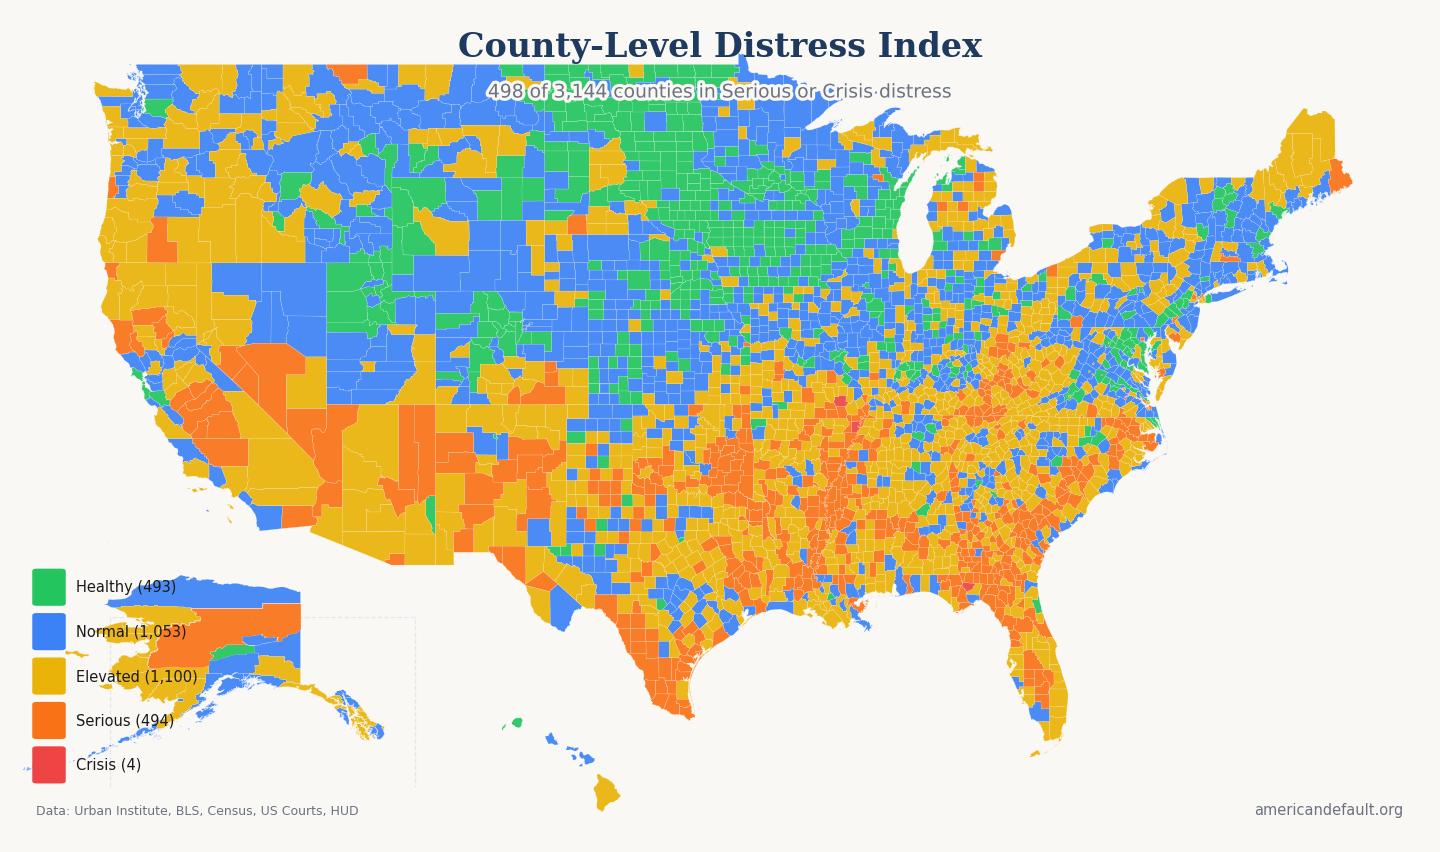
All 3,144 counties colored by distress zone. Hover for details; click released counties for full reports.
Score Distribution
How 3,144 county distress scores are distributed across the 0–100 scale. The median county scores 50.3.
50 Most Distressed Counties
Counties with the highest composite distress scores across all five domains. 498 counties are in Serious Stress or Crisis zones.
| Rank | County | State | Score | Zone | Primary Driver |
|---|---|---|---|---|---|
| 1 | Pemiscot County | MO | 82.9 | Crisis | Income & Poverty |
| 2 | Petersburg city | VA | 82.0 | Crisis | Housing Cost Burden |
| 3 | Gadsden County | FL | 80.3 | Crisis | Debt & Delinquency |
| 4 | Wayne County | MO | 80.2 | Crisis | Income & Poverty |
| 5 | Dunklin County | MO | 79.7 | Serious Stress | Debt & Delinquency |
| 6 | Mitchell County | GA | 79.6 | Serious Stress | Debt & Delinquency |
| 7 | Phillips County | AR | 79.2 | Serious Stress | Income & Poverty |
| 8 | Sequoyah County | OK | 79.2 | Serious Stress | Community Vulnerability |
| 9 | Starr County | TX | 79.2 | Serious Stress | Income & Poverty |
| 10 | Dougherty County | GA | 79.0 | Serious Stress | Income & Poverty |
| 11 | Humphreys County | MS | 79.0 | Serious Stress | Income & Poverty |
| 12 | Lee County | AR | 78.8 | Serious Stress | Income & Poverty |
| 13 | Richmond County | GA | 78.6 | Serious Stress | Debt & Delinquency |
| 14 | Wilkinson County | MS | 78.2 | Serious Stress | Income & Poverty |
| 15 | Washington County | MS | 78.1 | Serious Stress | Income & Poverty |
| 16 | Hancock County | TN | 78.1 | Serious Stress | Income & Poverty |
| 17 | Jim Wells County | TX | 78.1 | Serious Stress | Income & Poverty |
| 18 | Holmes County | MS | 77.8 | Serious Stress | Income & Poverty |
| 19 | Bell County | KY | 77.8 | Serious Stress | Income & Poverty |
| 20 | Dimmit County | TX | 77.8 | Serious Stress | Income & Poverty |
| 21 | Bronx County | NY | 77.7 | Serious Stress | Income & Poverty |
| 22 | Hancock County | GA | 77.5 | Serious Stress | Income & Poverty |
| 23 | Issaquena County | MS | 77.4 | Serious Stress | Income & Poverty |
| 24 | Hardee County | FL | 77.3 | Serious Stress | Housing Cost Burden |
| 25 | Halifax County | NC | 77.3 | Serious Stress | Income & Poverty |
| 26 | Madison Parish | LA | 77.2 | Serious Stress | Income & Poverty |
| 27 | Adair County | OK | 77.2 | Serious Stress | Community Vulnerability |
| 28 | Bertie County | NC | 77.1 | Serious Stress | Income & Poverty |
| 29 | Yazoo County | MS | 77.1 | Serious Stress | Debt & Delinquency |
| 30 | Ripley County | MO | 77.0 | Serious Stress | Community Vulnerability |
| 31 | Bee County | TX | 76.9 | Serious Stress | Income & Poverty |
| 32 | Scotland County | NC | 76.8 | Serious Stress | Income & Poverty |
| 33 | McIntosh County | OK | 76.8 | Serious Stress | Community Vulnerability |
| 34 | Seminole County | OK | 76.8 | Serious Stress | Community Vulnerability |
| 35 | Quitman County | GA | 76.7 | Serious Stress | Community Vulnerability |
| 36 | Duval County | TX | 76.7 | Serious Stress | Income & Poverty |
| 37 | Mississippi County | MO | 76.6 | Serious Stress | Income & Poverty |
| 38 | Bolivar County | MS | 76.5 | Serious Stress | Income & Poverty |
| 39 | Noxubee County | MS | 76.5 | Serious Stress | Community Vulnerability |
| 40 | Lauderdale County | TN | 76.4 | Serious Stress | Debt & Delinquency |
| 41 | Robeson County | NC | 76.3 | Serious Stress | Income & Poverty |
| 42 | Brooks County | TX | 76.2 | Serious Stress | Income & Poverty |
| 43 | Uvalde County | TX | 76.2 | Serious Stress | Income & Poverty |
| 44 | DeSoto County | FL | 76.2 | Serious Stress | Community Vulnerability |
| 45 | Charlton County | GA | 76.1 | Serious Stress | Debt & Delinquency |
| 46 | McKinley County | NM | 76.1 | Serious Stress | Income & Poverty |
| 47 | Vance County | NC | 76.1 | Serious Stress | Income & Poverty |
| 48 | Bibb County | GA | 76.1 | Serious Stress | Debt & Delinquency |
| 49 | Crosby County | TX | 76.0 | Serious Stress | Community Vulnerability |
| 50 | Sharkey County | MS | 75.8 | Serious Stress | Income & Poverty |
50 Least Distressed Counties
Counties with the lowest distress scores — strong employment, low debt delinquency, and affordable housing.
| Rank | County | State | Score | Zone | Primary Driver |
|---|---|---|---|---|---|
| 3144 | Los Alamos County | NM | 13.3 | Healthy | Employment & Wages |
| 3143 | Goochland County | VA | 13.9 | Healthy | Housing Cost Burden |
| 3142 | Oldham County | KY | 15.1 | Healthy | Housing Cost Burden |
| 3141 | Lincoln County | SD | 15.2 | Healthy | Housing Cost Burden |
| 3140 | Edmunds County | SD | 15.8 | Healthy | Income & Poverty |
| 3139 | Williamson County | TN | 15.9 | Healthy | Housing Cost Burden |
| 3138 | Hamilton County | IN | 16.6 | Healthy | Housing Cost Burden |
| 3137 | Steele County | ND | 16.7 | Healthy | Employment & Wages |
| 3136 | Lyon County | IA | 16.9 | Healthy | Employment & Wages |
| 3135 | Cavalier County | ND | 17.1 | Healthy | Employment & Wages |
| 3134 | Billings County | ND | 17.3 | Healthy | Income & Poverty |
| 3133 | Hamilton County | NE | 17.5 | Healthy | Housing Cost Burden |
| 3132 | Hamlin County | SD | 18.3 | Healthy | Community Vulnerability |
| 3131 | Oconee County | GA | 18.3 | Healthy | Employment & Wages |
| 3130 | Nemaha County | KS | 18.3 | Healthy | Employment & Wages |
| 3129 | Grundy County | IA | 18.4 | Healthy | Employment & Wages |
| 3128 | Plymouth County | IA | 18.5 | Healthy | Housing Cost Burden |
| 3127 | LaMoure County | ND | 18.7 | Healthy | Income & Poverty |
| 3126 | Boone County | NE | 18.7 | Healthy | Income & Poverty |
| 3125 | Delaware County | OH | 18.8 | Healthy | Housing Cost Burden |
| 3124 | Traill County | ND | 18.8 | Healthy | Housing Cost Burden |
| 3123 | Morgan County | UT | 19.0 | Healthy | Employment & Wages |
| 3122 | Dallas County | IA | 19.1 | Healthy | Housing Cost Burden |
| 3121 | Bowman County | ND | 19.3 | Healthy | Income & Poverty |
| 3120 | Sully County | SD | 19.6 | Healthy | Community Vulnerability |
| 3119 | Union County | SD | 19.6 | Healthy | Housing Cost Burden |
| 3118 | McLean County | ND | 19.6 | Healthy | Employment & Wages |
| 3117 | Winneshiek County | IA | 19.8 | Healthy | Employment & Wages |
| 3116 | Ransom County | ND | 19.8 | Healthy | Housing Cost Burden |
| 3115 | Osage County | MO | 19.8 | Healthy | Employment & Wages |
| 3114 | Hand County | SD | 20.1 | Healthy | Employment & Wages |
| 3113 | Hanson County | SD | 20.2 | Healthy | Community Vulnerability |
| 3112 | Hyde County | SD | 20.4 | Healthy | Income & Poverty |
| 3111 | Sargent County | ND | 20.5 | Healthy | Employment & Wages |
| 3110 | Bremer County | IA | 20.6 | Healthy | Employment & Wages |
| 3109 | Botetourt County | VA | 20.8 | Healthy | Employment & Wages |
| 3108 | Burke County | ND | 20.8 | Healthy | Employment & Wages |
| 3107 | Iowa County | WI | 20.8 | Healthy | Housing Cost Burden |
| 3106 | Warrick County | IN | 20.9 | Healthy | Debt & Delinquency |
| 3105 | Deuel County | SD | 21.0 | Healthy | Community Vulnerability |
| 3104 | Sioux County | IA | 21.0 | Healthy | Housing Cost Burden |
| 3103 | Boone County | IN | 21.0 | Healthy | Employment & Wages |
| 3102 | Summit County | UT | 21.1 | Healthy | Housing Cost Burden |
| 3101 | Union County | OH | 21.2 | Healthy | Employment & Wages |
| 3100 | Warren County | OH | 21.2 | Healthy | Housing Cost Burden |
| 3099 | Waukesha County | WI | 21.3 | Healthy | Housing Cost Burden |
| 3098 | Bottineau County | ND | 21.4 | Healthy | Community Vulnerability |
| 3097 | Pembina County | ND | 21.6 | Healthy | Community Vulnerability |
| 3096 | Oliver County | ND | 21.7 | Healthy | Employment & Wages |
| 3095 | Ozaukee County | WI | 21.8 | Healthy | Housing Cost Burden |
Browse by State
Select a state to see county-level distress data, rankings, and maps.
Alabama
Alaska
Arizona
Arkansas
California
Colorado
Connecticut
Delaware
District of Columbia
Florida
Georgia
Hawaii
Idaho
Illinois
Indiana
Iowa
Kansas
Kentucky
Louisiana
Maine
Maryland
Massachusetts
Michigan
Minnesota
Mississippi
Missouri
Montana
Nebraska
Nevada
New Hampshire
New Jersey
New Mexico
New York
North Carolina
North Dakota
Ohio
Oklahoma
Oregon
Pennsylvania
Rhode Island
South Carolina
South Dakota
Tennessee
Texas
Utah
Vermont
Virginia
Washington
West Virginia
Wisconsin
Wyoming
How County Scores Work
Each county is scored 0–100 using percentile-rank averaging across five data domains: Debt & Delinquency, Income & Poverty, Housing Cost Burden, Employment & Wages, and Community Vulnerability. A score of 50 means the county falls at the national median. Higher scores indicate greater financial distress.
County detail pages are being published on a rolling basis. 99 of 3,144 county reports are currently available, with new counties added weekly. All 3,144 counties are scored and visible on the map above.
Frequently Asked Questions
What data sources are used for county distress scores?
County scores draw from six federal and nonprofit data sources: the Urban Institute (debt delinquency), Bureau of Labor Statistics (unemployment), Census Bureau (poverty, housing burden, business formation), HUD (fair market rents), US Courts (bankruptcy filings), and BLS QCEW (wages). Each county is scored across 19 individual indicators grouped into five domains.
How often are county scores updated?
County data is updated as new source data becomes available — typically monthly for employment and wages, annually for Census poverty and housing data. The composite scores are recomputed after each data update. New county detail pages are published weekly.
How do county scores differ from the national American Distress Index?
The national ADI tracks household financial distress over time using quarterly time-series data. County scores are cross-sectional — they compare counties to each other at a point in time using percentile-rank averaging. Both use a 0–100 scale with the same zone thresholds, but they measure different things: the ADI tracks trends, county scores compare places.