State Distress Index · SDI
The most financially distressed states, November 2026
Louisiana is the most financially distressed state, with a State Distress Index score of 100, followed by Nevada (98), Florida (96), Mississippi (94) and Michigan (92). North Dakota (0), New Hampshire (2) and South Dakota (4) are the least distressed. A state’s score is the share of the 50 states and D.C. it is more distressed than; 16 of the 51 score 70 or more.
- Published
- Nov 4, 2026
- Data through
- Sep 2026
Louisiana, Nevada and Florida score highest on the State Distress Index
State Distress Index, November 2026 release: scores for the 50 states and D.C. Inputs cover different periods; see sources. The number on each state is its rank.
Tap a state for its rank and score.
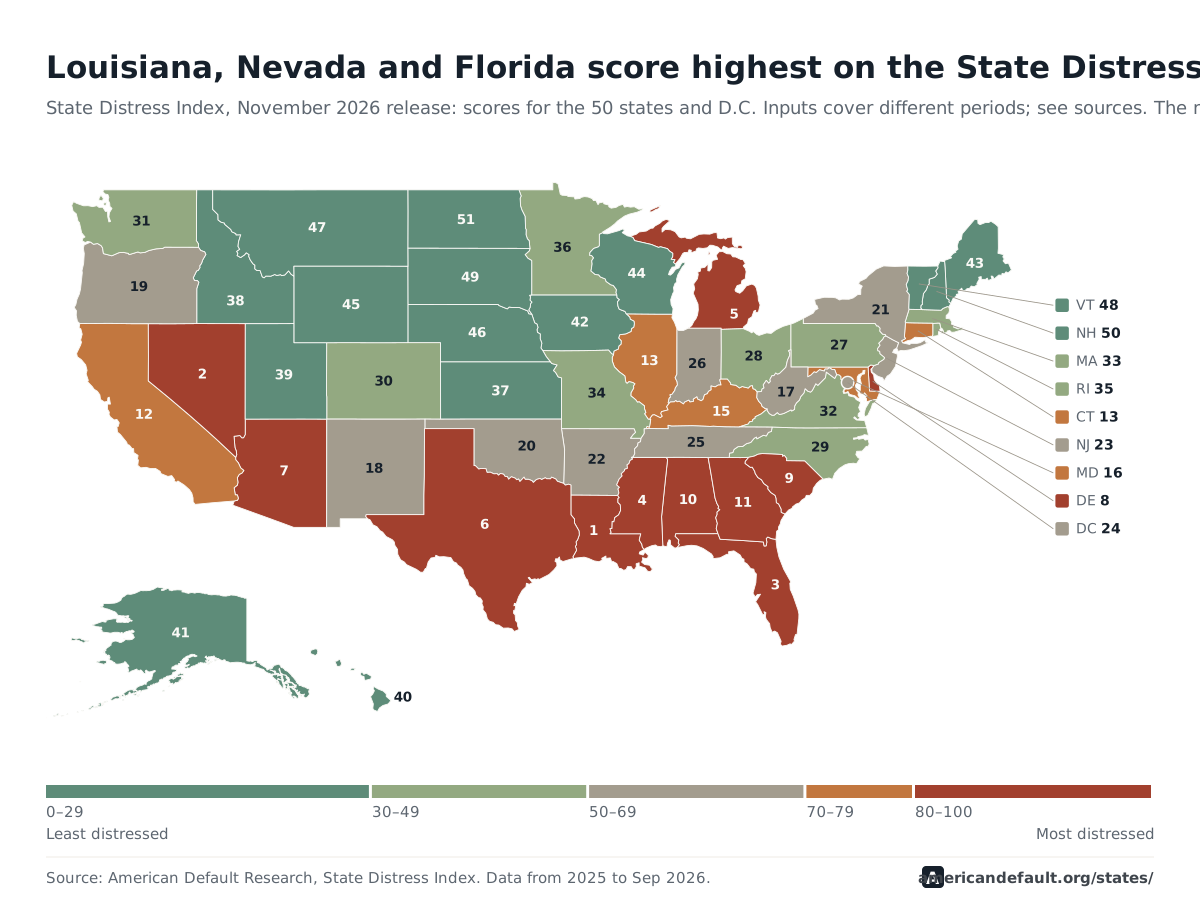
All 50 states and D.C., ranked
| Rank | State | Score (0–100) | Score group | Highest part |
|---|---|---|---|---|
| 1st | LouisianaLate payments | 100 | 80–100 | Late payments |
| 2nd | NevadaCollections and bankruptcy | 98 | 80–100 | Collections and bankruptcy |
| 3rd | FloridaRenters’ housing costs | 96 | 80–100 | Renters’ housing costs |
| 4th | MississippiLate payments | 94 | 80–100 | Late payments |
| 5th | MichiganJobs | 92 | 80–100 | Jobs |
| 6th | TexasLate payments | 90 | 80–100 | Late payments |
| 7th | ArizonaJobs | 88 | 80–100 | Jobs |
| 8th | DelawareJobs | 86 | 80–100 | Jobs |
| 9th | South CarolinaLate payments | 84 | 80–100 | Late payments |
| 10th | AlabamaCollections and bankruptcy | 82 | 80–100 | Collections and bankruptcy |
| 11th | GeorgiaCollections and bankruptcy | 80 | 80–100 | Collections and bankruptcy |
| 12th | CaliforniaRenters’ housing costs | 78 | 70–79 | Renters’ housing costs |
| tied for 13th | ConnecticutJobs | 74 | 70–79 | Jobs |
| tied for 13th | IllinoisJobs | 74 | 70–79 | Jobs |
| 15th | KentuckyCollections and bankruptcy | 72 | 70–79 | Collections and bankruptcy |
| 16th | MarylandRenters’ housing costs | 70 | 70–79 | Renters’ housing costs |
| 17th | West VirginiaLate payments | 68 | 50–69 | Late payments |
| 18th | New MexicoJobs | 66 | 50–69 | Jobs |
| 19th | OregonJobs | 64 | 50–69 | Jobs |
| 20th | OklahomaLate payments | 62 | 50–69 | Late payments |
| 21st | New YorkRenters’ housing costs | 60 | 50–69 | Renters’ housing costs |
| 22nd | ArkansasCollections and bankruptcy | 58 | 50–69 | Collections and bankruptcy |
| 23rd | New JerseyRenters’ housing costs | 56 | 50–69 | Renters’ housing costs |
| 24th | District of ColumbiaJobs | 54 | 50–69 | Jobs |
| 25th | TennesseeCollections and bankruptcy | 52 | 50–69 | Collections and bankruptcy |
| 26th | IndianaCollections and bankruptcy | 50 | 50–69 | Collections and bankruptcy |
| 27th | PennsylvaniaLate payments | 48 | 30–49 | Late payments |
| 28th | OhioCollections and bankruptcy | 46 | 30–49 | Collections and bankruptcy |
| 29th | North CarolinaLate payments | 44 | 30–49 | Late payments |
| 30th | ColoradoRenters’ housing costs | 42 | 30–49 | Renters’ housing costs |
| 31st | WashingtonJobs | 40 | 30–49 | Jobs |
| 32nd | VirginiaCollections and bankruptcy | 38 | 30–49 | Collections and bankruptcy |
| 33rd | MassachusettsRenters’ housing costs | 36 | 30–49 | Renters’ housing costs |
| 34th | MissouriCollections and bankruptcy | 34 | 30–49 | Collections and bankruptcy |
| 35th | Rhode IslandLate payments | 32 | 30–49 | Late payments |
| 36th | MinnesotaJobs | 30 | 30–49 | Jobs |
| 37th | KansasCollections and bankruptcy | 28 | 0–29 | Collections and bankruptcy |
| 38th | IdahoRenters’ housing costs | 26 | 0–29 | Renters’ housing costs |
| 39th | UtahCollections and bankruptcy | 24 | 0–29 | Collections and bankruptcy |
| 40th | HawaiiRenters’ housing costs | 22 | 0–29 | Renters’ housing costs |
| 41st | AlaskaJobs | 20 | 0–29 | Jobs |
| 42nd | IowaCollections and bankruptcy | 18 | 0–29 | Collections and bankruptcy |
| 43rd | MaineRenters’ housing costs | 16 | 0–29 | Renters’ housing costs |
| 44th | WisconsinCollections and bankruptcy | 14 | 0–29 | Collections and bankruptcy |
| 45th | WyomingCollections and bankruptcy | 12 | 0–29 | Collections and bankruptcy |
| 46th | NebraskaCollections and bankruptcy | 10 | 0–29 | Collections and bankruptcy |
| 47th | MontanaCollections and bankruptcy | 8 | 0–29 | Collections and bankruptcy |
| 48th | VermontRenters’ housing costs | 6 | 0–29 | Renters’ housing costs |
| 49th | South DakotaLate payments | 4 | 0–29 | Late payments |
| 50th | New HampshireRenters’ housing costs | 2 | 0–29 | Renters’ housing costs |
| 51st | North DakotaLate payments and Collections and bankruptcy | 0 | 0–29 | Late payments and Collections and bankruptcy |
Source: American Default Research, State Distress Index. The colored square is the score group (see the map legend). Download this table (CSV)
Why the top states rank high
The five highest-ranked states get there in different ways. The highest part is late payments for Louisiana and Mississippi, collections and bankruptcy for Nevada, renters’ housing costs for Florida, and jobs for Michigan. A similar score can come from a different mix of parts, so a state’s rank says less than its mix does.
Across all 51, late payments is the highest part for 11, collections and bankruptcy for 18, jobs for 11 and renters’ housing costs for 12. The renters’ housing costs part counts renters who pay half or more of their income in rent (Census Bureau, 2025).
Six of the 10 highest-ranked jurisdictions are in the South.
The 10 highest-ranked jurisdictions, by region
| Region | Jurisdictions | In the top 10 | Highest ranked | Rank | Score |
|---|---|---|---|---|---|
| South14 jurisdictions | 14 | 6 | Louisiana 1st · 100 | 1st | 100 |
| Northeast12 jurisdictions | 12 | 1 | Delaware 8th · 86 | 8th | 86 |
| Midwest12 jurisdictions | 12 | 1 | Michigan 5th · 92 | 5th | 92 |
| West13 jurisdictions | 13 | 2 | Nevada 2nd · 98 | 2nd | 98 |
Source: American Default Research, State Distress Index. U.S. Census Bureau regions, except Delaware, D.C. and Maryland, grouped here with the Northeast.
Which states have strong jobs but high bills?
A low unemployment rate is supposed to mean households are doing fine. In 11 states it doesn't. Unemployment in September 2026 was below the U.S. rate of 4.2%, while the share of loan balances 90 or more days past due was above the U.S. figure on at least two of three loan types (credit cards, auto loans and mortgages) in Q4 2025. They are Alabama, Arkansas, Georgia, Indiana, Louisiana, Maryland, Mississippi, North Carolina, Ohio, South Carolina and West Virginia.
| State | Unemployment (%) | Vs U.S. (points) | Cards, 90+ days late (%) | Autos, 90+ days late (%) | Mortgages, 90+ days late (%) | Above U.S. | Group |
|---|---|---|---|---|---|---|---|
| Alabama | 3.5 | −0.7 | 12.2 | 6.5 | 1.15 | 2 of 3 | Strong jobs · high bills |
| Arkansas | 3.9 | −0.3 | 13.8 | 5.6 | 1.08 | 3 of 3 | Strong jobs · high bills |
| Georgia | 3.3 | −0.9 | 13.9 | 7.0 | 1.27 | 3 of 3 | Strong jobs · high bills |
| Indiana | 3.4 | −0.8 | 11.7 | 6.3 | 1.10 | 2 of 3 | Strong jobs · high bills |
| Louisiana | 4.0 | −0.2 | 14.2 | 6.5 | 1.83 | 3 of 3 | Strong jobs · high bills |
| Maryland | 3.9 | −0.3 | 11.7 | 6.0 | 1.11 | 2 of 3 | Strong jobs · high bills |
| Mississippi | 3.3 | −0.9 | 13.4 | 7.7 | 1.71 | 3 of 3 | Strong jobs · high bills |
| North Carolina | 3.4 | −0.8 | 12.5 | 6.1 | 0.89 | 2 of 3 | Strong jobs · high bills |
| Ohio | 3.4 | −0.8 | 11.1 | 5.3 | 0.96 | 2 of 3 | Strong jobs · high bills |
| South Carolina | 4.0 | −0.2 | 13.4 | 6.2 | 1.15 | 3 of 3 | Strong jobs · high bills |
| West Virginia | 4.0 | −0.2 | 13.7 | 5.3 | 1.15 | 3 of 3 | Strong jobs · high bills |
| Colorado | 4.1 | −0.1 | 11.1 | 4.0 | 0.75 | 0 of 3 | Strong jobs · bills in check |
| Hawaii | 2.8 | −1.4 | 10.2 | 3.7 | 0.56 | 0 of 3 | Strong jobs · bills in check |
| Idaho | 3.6 | −0.6 | 9.5 | 3.3 | 0.74 | 0 of 3 | Strong jobs · bills in check |
| Iowa | 3.2 | −1.0 | 10.3 | 3.5 | 0.81 | 0 of 3 | Strong jobs · bills in check |
| Kansas | 3.8 | −0.4 | 10.7 | 4.0 | 0.82 | 0 of 3 | Strong jobs · bills in check |
| Maine | 3.3 | −0.9 | 9.8 | 3.1 | 0.84 | 0 of 3 | Strong jobs · bills in check |
| Missouri | 3.6 | −0.6 | 11.3 | 5.5 | 0.84 | 1 of 3 | Strong jobs · bills in check |
| Montana | 3.1 | −1.1 | 9.8 | 4.0 | 0.50 | 0 of 3 | Strong jobs · bills in check |
| Nebraska | 2.9 | −1.3 | 9.8 | 3.3 | 0.65 | 0 of 3 | Strong jobs · bills in check |
| New Hampshire | 2.6 | −1.6 | 9.8 | 3.0 | 0.61 | 0 of 3 | Strong jobs · bills in check |
| North Dakota | 2.2 | −2.0 | 9.0 | 2.9 | 0.94 | 0 of 3 | Strong jobs · bills in check |
| Pennsylvania | 3.6 | −0.6 | 12.3 | 4.8 | 1.10 | 1 of 3 | Strong jobs · bills in check |
| Rhode Island | 3.6 | −0.6 | 11.4 | 3.5 | 1.00 | 1 of 3 | Strong jobs · bills in check |
| South Dakota | 2.0 | −2.2 | 9.1 | 3.6 | 0.79 | 0 of 3 | Strong jobs · bills in check |
| Tennessee | 3.4 | −0.8 | 11.6 | 5.7 | 0.72 | 1 of 3 | Strong jobs · bills in check |
| Utah | 3.5 | −0.7 | 9.4 | 3.0 | 0.70 | 0 of 3 | Strong jobs · bills in check |
| Vermont | 2.6 | −1.6 | 9.0 | 2.8 | 0.62 | 0 of 3 | Strong jobs · bills in check |
| Virginia | 3.6 | −0.6 | 9.8 | 4.6 | 0.65 | 0 of 3 | Strong jobs · bills in check |
| Wisconsin | 3.2 | −1.0 | 8.0 | 3.6 | 0.47 | 0 of 3 | Strong jobs · bills in check |
| Wyoming | 3.0 | −1.2 | 10.5 | 3.5 | 0.76 | 0 of 3 | Strong jobs · bills in check |
| Arizona | 4.9 | +0.7 | 13.7 | 5.6 | 0.94 | 2 of 3 | Softer jobs · high bills |
| Delaware | 4.6 | +0.4 | 12.2 | 6.1 | 1.13 | 2 of 3 | Softer jobs · high bills |
| District of Columbia | 5.6 | +1.4 | 11.2 | 13.6 | 1.01 | 2 of 3 | Softer jobs · high bills |
| Florida | 4.4 | +0.2 | 14.9 | 5.5 | 1.43 | 3 of 3 | Softer jobs · high bills |
| Illinois | 4.6 | +0.4 | 11.6 | 5.6 | 1.15 | 2 of 3 | Softer jobs · high bills |
| Nevada | 4.7 | +0.5 | 16.3 | 6.2 | 0.86 | 2 of 3 | Softer jobs · high bills |
| New Mexico | 4.7 | +0.5 | 11.9 | 6.1 | 1.01 | 2 of 3 | Softer jobs · high bills |
| New York | 4.3 | +0.1 | 12.9 | 4.3 | 1.36 | 2 of 3 | Softer jobs · high bills |
| Oklahoma | 4.2 | 0.0 | 13.3 | 5.5 | 1.32 | 3 of 3 | Softer jobs · high bills |
| Texas | 4.4 | +0.2 | 14.2 | 5.8 | 1.21 | 3 of 3 | Softer jobs · high bills |
| Alaska | 4.3 | +0.1 | 9.8 | 2.9 | 0.72 | 0 of 3 | Softer jobs · bills in check |
| California | 5.1 | +0.9 | 13.2 | 4.8 | 0.63 | 1 of 3 | Softer jobs · bills in check |
| Connecticut | 5.1 | +0.9 | 10.5 | 3.1 | 0.97 | 1 of 3 | Softer jobs · bills in check |
| Kentucky | 4.7 | +0.5 | 11.8 | 4.9 | 1.04 | 1 of 3 | Softer jobs · bills in check |
| Massachusetts | 4.3 | +0.1 | 10.3 | 2.6 | 0.72 | 0 of 3 | Softer jobs · bills in check |
| Michigan | 5.0 | +0.8 | 11.3 | 6.3 | 0.86 | 1 of 3 | Softer jobs · bills in check |
| Minnesota | 4.5 | +0.3 | 8.6 | 3.0 | 0.63 | 0 of 3 | Softer jobs · bills in check |
| New Jersey | 4.2 | 0.0 | 11.4 | 4.2 | 1.12 | 1 of 3 | Softer jobs · bills in check |
| Oregon | 5.0 | +0.8 | 9.5 | 3.6 | 0.64 | 0 of 3 | Softer jobs · bills in check |
| Washington | 4.8 | +0.6 | 9.3 | 3.8 | 0.57 | 0 of 3 | Softer jobs · bills in check |
Source: U.S. Bureau of Labor Statistics Local Area Unemployment Statistics; New York Fed Consumer Credit Panel / Equifax
How to read this
Unemployment is each state's seasonally adjusted rate for September 2026 from the Bureau of Labor Statistics (Local Area Unemployment Statistics), set against the U.S. rate for the same month. The three delinquency columns are the share of each loan type's balances 90 or more days past due in Q4 2025, from the New York Fed Consumer Credit Panel / Equifax. The "Above U.S." column counts the loan types on which a state's rate is above the New York Fed's U.S. figure (credit cards 12.4%, auto loans 5.2%, mortgages 0.94%).
A state is in the strong-jobs groups when its unemployment rate is below the U.S. rate, and in the high-bills groups when its delinquency rate is above the U.S. figure on at least two of the three loan types. The two sources cover different periods, so the grouping pairs the latest month of jobs data with the latest year-end credit data. The comparisons with the U.S. figures are American Default Research calculations from the BLS and New York Fed data. This section does not change the State Distress Index ranking above.
Questions about the State Distress Index
Which state has the highest financial distress?
Louisiana. It scores 100 on the State Distress Index, the top of the scale, and the part it scores highest on is late payments.
Which state has the lowest financial distress?
North Dakota, at 0. New Hampshire and South Dakota are next.
How is the State Distress Index calculated?
It has four equal parts: late payments; collections and bankruptcy; jobs; and renters’ housing costs. Each measure is ranked against the 50 states and D.C. A state’s score is the share of the other 50 with a lower average across the four parts, rounded down, so rank 1 is the most distressed. States tie only when their averages are identical.
How does the State Distress Index differ from the American Distress Index?
The American Distress Index tracks the nation over time, ranking each measure against its own history. The State Distress Index compares the states with each other at one point in time. It shows where distress is highest compared with other states, not whether conditions in any state are getting better or worse.
Where are the most distressed states?
Mostly in the South: six of the 10 highest-ranked jurisdictions. Two are in the West, one in the Northeast and one in the Midwest.
Sources and method
The score has four equal parts: late payments; collections and bankruptcy; jobs; and renters’ housing costs. Each measure is ranked against the 50 states and D.C., each part averages its measures’ ranks, and a state’s score is the share of the other 50 with a lower average across the four parts. Rank 1 is the most distressed. The measures cover different periods, listed below; the score compares states with each other and does not say whether conditions are getting better or worse.
- Federal Reserve Bank of Philadelphia, Consumer Credit Explorer. Shares of borrowers 90 or more days behind on credit cards, auto loans and mortgages, and the share with a debt in collections, Q2 2026. Built on the New York Fed Consumer Credit Panel / Equifax.
- Administrative Office of the U.S. Courts, Table F-2. Bankruptcy filings per 100,000 people, 2025. Filing numbers partly reflect each state’s laws.
- U.S. Census Bureau, American Community Survey 1-year, table B25070. Renters who pay half or more of their income in rent, 2025.
- Bureau of Labor Statistics, Local Area Unemployment Statistics. Unemployment rate, average of July to September 2026.
- Federal Reserve Bank of New York, Consumer Credit Panel / Equifax. Balances 90 or more days late by loan type. Used in the jobs and bills section only, not in the score.
We write with AI tools, and Ross Kilburn checks and reviews every page before it's published.