Washington County, Mississippi
4× the national median for auto loan delinquency.
Main Findings
Washington County, Mississippi ranks fifth most distressed in the United States on the County Distress Index. The driver: 20% of auto loan accounts are 60+ days past due — more than double the national median of 5%.
- 5th of 3,144 counties on the County Distress Index — Most distressed fifth, 3rd in Mississippi.
- 20% of auto loan accounts are 60+ days past due (U.S. median 5%). Auto loan delinquency at the 100th percentile nationally.
- Debt in collections at 42% — national median 23%, ranked at the 97th percentile.
- Child poverty rate at 47% — national median 18%, ranked at the 100th percentile.
- Severe rent burden (50%+) at 27% — national median 18%, ranked at the 92nd percentile.
Unemployment is 5%, near the national median of 4%, while auto loan delinquency runs at the 100th percentile. Jobs exist; wages don't close the gap.
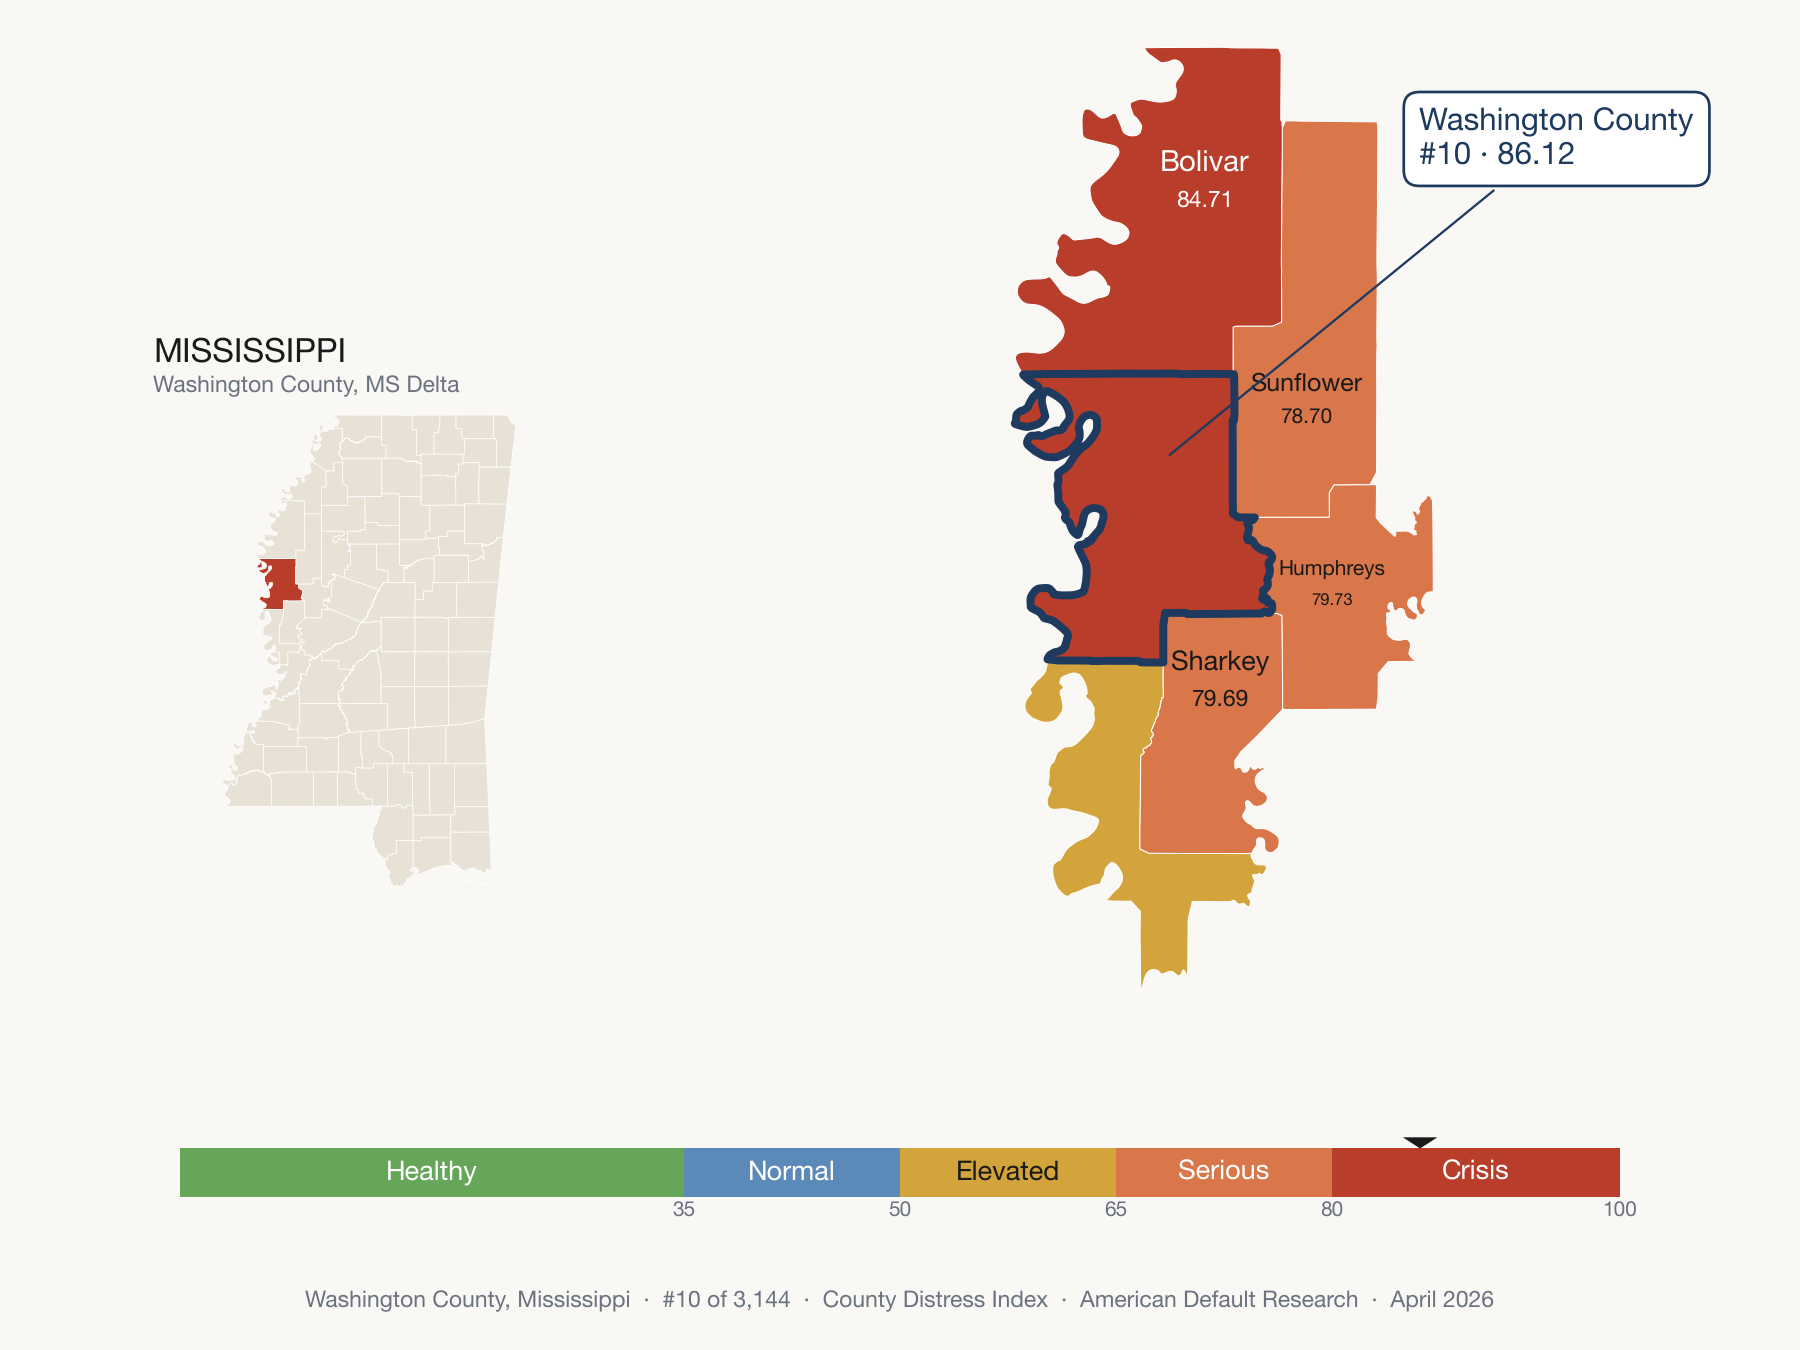
"Washington County ranks in the most distressed fifth of U.S. counties. The five-domain profile shows where local household pressure is most concentrated."
"The CDI places this county in the most distressed fifth nationally. The rank is the important geography signal: it compares the county with every other county-equivalent in the release."
Reporter's Notes
Two data points in the indicator table worth a follow-up call.
47% of children under 18 in Washington County live below the federal poverty line, versus 18% nationally. When a county's adult poverty rate is accompanied by a materially higher child poverty rate, the gap typically reflects single-parent household concentration or limited access to workforce-participation supports (childcare, transportation). Worth a call to the local school district's free-and-reduced-lunch coordinator or a regional United Way affiliate.
The Indicators Behind Washington County's CDI Score
Every number traces to a public source. Washington County's value shown alongside MS's median and the U.S. median. Full CSV available for download.
| Indicator | Washington | MS median | U.S. median | Pctile | Source |
|---|---|---|---|---|---|
| Delinquency — domain score 99 · Rank 3 of 3,144 | |||||
| Auto loan delinquency Share of auto loan accounts 60+ days past due | 20% | 10% | 5% | 100th | Urban Institute (2024) |
| Credit card delinquency Share of credit card accounts 60+ days past due | 13% | 9% | 5% | 99th | Urban Institute (2024) |
| Subprime credit share Share of residents with a credit score below 660 | 45% | 38% | 23% | 99th | Urban Institute (2024) |
| Default & Legal — domain score 95 · Rank 23 of 3,144 | |||||
| Debt in collections Share of residents with a credit file who have debt in collections | 42% | 31% | 23% | 97th | Urban Institute (2024) |
| Bankruptcy filing rate Personal bankruptcy filings per 100,000 residents | 346 | 314 | 126 | 94th | US Courts F-5A (2025) |
| Debt Burden (housing basis) — domain score 88 · Rank 192 of 3,144 | |||||
| Rent-to-income ratio Fair Market Rent (2BR) as share of median household income | 26% | 22% | 21% | 84th | HUD FMR × Census ACS (2024) |
| Severe rent burden (50%+) Share of renter households paying 50%+ of income on rent | 27% | 19% | 18% | 92nd | Census ACS 5-yr (2023) |
| Labor — domain score 84 · Rank 509 of 3,144 | |||||
| Unemployment Share of labor force unemployed | 5% | 3% | 4% | 84th | BLS LAUS (Dec 2025) |
| Safety Net & Buffer — domain score 93 · Rank 10 of 3,144 | |||||
| Child poverty rate Share of children under 18 below the federal poverty line | 47% | 28% | 18% | 100th | Census SAIPE (2023) |
| Disability rate Share of residents reporting a disability | 25% | 19% | 16% | 96th | Census ACS 5-yr (2023) |
| Poverty rate Share of population below the federal poverty line | 36% | 20% | 14% | 100th | Census SAIPE (2023) |
| Transfer-income dependency Share of personal income from government transfers | 36% | 34% | 27% | 86th | BEA Regional Personal Income (2023) |
| Uninsured rate Share of residents without health insurance coverage | 12% | 12% | 8% | 78th | Census ACS 5-yr (2023) |
Five-Domain Breakdown
The CDI is an equal-weight composite of five family-v1 distress domains. Each domain contributes 20% of the county score.
Methodology
The County Distress Index is a 0–100 composite score of household financial distress, computed for all 3,144 U.S. counties. Higher scores indicate greater distress. The index is built from five equal-weighted domains: Delinquency, Default & Legal, Debt Burden, Labor, and Safety Net & Buffer. Each domain is the mean of distress-oriented indicator percentiles; the CDI score is the equal-weight mean of those domain scores.
Data sources include the Urban Institute Debt in America (Equifax consumer credit panel), U.S. Census Bureau (American Community Survey 5-year, Small Area Income and Poverty Estimates, Business Formation Statistics), Bureau of Labor Statistics (Local Area Unemployment Statistics, Quarterly Census of Employment and Wages), U.S. Courts Administrative Office (F-5A bankruptcy filings), and HUD Fair Market Rents. Data vintages range from 2023 to 2025 depending on source; full indicator-level vintage detail is in the methodology document.
For Press & Research
Everything you need to cite Washington County data — in under 60 seconds.
Draft wire copy 149-word AP-style article — use freely with attribution
GREENVILLE, Miss. — Washington County ranks fifth among the nation's most financially distressed counties, according to the County Distress Index released this month by American Default Research.
The composite score of 92 out of 100 places Washington in the most distressed fifth. Among 3,144 U.S. counties scored, only 4 rank more distressed. Within Mississippi, Washington ranks third of 82 counties.
The index, which draws on 16 source indicators from the U.S. Census Bureau, Bureau of Labor Statistics, Urban Institute and federal court filings, identifies delinquency as the primary driver in Washington. 20% of auto loan accounts are 60+ days past due — more than double the national median of 5%.
"Washington County ranks in the most distressed fifth of U.S. counties. The five-domain profile shows where local household pressure is most concentrated," said Ross Kilburn, founder of American Default Research.
Full methodology and county-by-county data are available at americandefault.org/methodology/cdi.
Frequently Asked Questions
What is Washington County's CDI score, and what does it mean?
What drives Washington County's distress score?
How does Washington County compare to its neighbors?
How is the County Distress Index calculated?

Washington County resident looking for help? HUD counselors, legal aid, and attorney referrals →