Mortgage Debt Service Ratio
Mortgage payments as share of household income
What is the current Mortgage Debt Service Ratio?
The mortgage debt service ratio isolates the share of household income consumed specifically by mortgage payments. This measure helps distinguish between mortgage-related stress and non-housing debt stress, which have moved in different directions in the current cycle. Source: Federal Reserve via FRED.
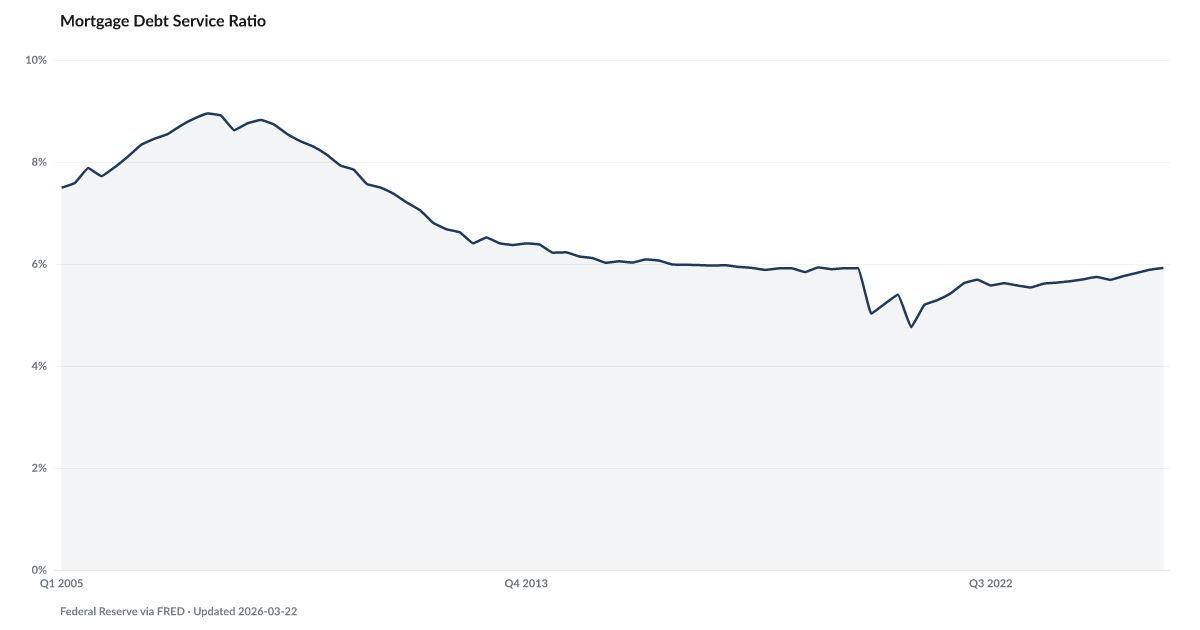
Mortgage payments now claim 5.9% of disposable income. Up from the 2021 low, though still well below the 9.0% high reached at the top of the 2007 housing cycle.
The Federal Reserve's Mortgage Debt Service Ratio, FRED series MDSP, measures household mortgage payments as a share of disposable income. The Q4 2025 reading is 5.9%. That's up from a 4.7% low in early 2021, at the bottom of the pandemic rate-cut cycle. The pre-Great-Recession high, in late 2007, was 9.0%.
The increase reflects a specific mechanic. Existing mortgage holders locked in sub-4% rates during 2020 and 2021 and are still carrying them. New originations priced off 7% rates are entering the stock slowly. The average rate on outstanding mortgages has crept up one basis point at a time as the payment share rose with it.
An increase off the bottom sounds dramatic. In context, it barely registers — because the starting point was historically low. That is what makes the pre-GFC comparison misleading. The gap from today to 9.0% measures the distance between a stock of borrowers locked into cheap debt and a future stock of borrowers paying market rates on everything. Not headroom. Pipeline.
As the locked-in stock rolls over — through moves, divorces, deaths, refinancings — the ratio will keep drifting upward. The Squeeze tightens with every basis point. The Safety Net thins further. And the relationship the American Distress Index has validated — Buffer Depletion leads Debt Stress by 9 quarters with r = 0.69 — turns that gradual drift into pressure on Falling Behind several quarters out.
Explore Further
How has Mortgage Debt Service Ratio changed over time?

Most affected counties
Counties with the highest safety net and buffer scores in the County Distress Index.
Explore all 3,144 counties →| Period | Value | YoY Change |
|---|---|---|
| Q4 2025 | 5.92% | +0.2 pts |
| Q3 2025 | 5.89% | +0.1 pts |
| Q2 2025 | 5.83% | +0.1 pts |
| Q1 2025 | 5.76% | +0.1 pts |
| Q4 2024 | 5.69% | +0.1 pts |
| Q3 2024 | 5.74% | +0.1 pts |
| Q2 2024 | 5.7% | +0.2 pts |
| Q1 2024 | 5.66% | +0.1 pts |
| Q4 2023 | 5.64% | +0.0 pts |
| Q3 2023 | 5.62% | +0.0 pts |
| Q2 2023 | 5.54% | −0.2 pts |
| Q1 2023 | 5.58% | −0.0 pts |
Frequently Asked Questions
What is the mortgage debt service ratio?
It measures mortgage payments as a percentage of household disposable personal income. In the current cycle, mortgage debt service has remained relatively contained because many homeowners locked in historically low rates during 2020–2021.
Why track mortgage debt service separately?
Mortgage and non-housing debt service have diverged in the current cycle. Low locked-in mortgage rates have kept mortgage debt service in check, while credit card and auto loan costs have surged. Tracking them separately reveals where the pressure actually is.
Where does this data come from?
The Federal Reserve publishes the mortgage debt service ratio quarterly as a component of the broader household debt service ratio. Available on FRED.

Quick poll
Is this affecting you or your household?
Discussion
Get the numbers when they move.
New data drops, indicator updates, and ADI score changes — delivered when it matters. No spam.
or Create an Account for full access
Loading comments…