The Squeeze
Nearly 24% — up from 23.7% in the prior reading, almost nothing left after necessities
What is the current Squeeze reading?
Nearly 24% of the households in Bank of America's checking-account sample now spend 95% or more of their income on necessities, according to Bank of America Institute analysis of internal depositor data — up from 23% in 2023. The sample is the bank's own checking customers, not a survey of the country, so it is not a rate for all U.S. households. Among lower-income households in that sample, the figure was 29% in the 2025 analysis, the highest in that published series. These are families with no discretionary spending left to cut and no margin for any unexpected expense. Source: Bank of America Institute (2025).
Measurement basis: Bank of America Institute's estimate of the share of households in its own checking-account sample whose necessary spending exceeds 95 percent of income. The sample is households that have held a U.S. Bank of America checking account for at least a year, whose payment channels the bank can observe, and who appear to bank primarily with Bank of America; Bank of America does not publish its size, and it is not a sample of U.S. households. Bank of America publishes the current reading rounded to a whole percent and qualified with “nearly”, not as a decimal. The two earlier observations are read from the report's chart, which prints no value for either year. The most recent observation covers data through the third quarter of its publication year.
In Bank of America's own deposit data, the gap between what families earn and what they must spend has narrowed to almost nothing for a growing share of households.
Bank of America Institute analysis of internal depositor data shows that nearly 24% of the households in its checking-account sample now spend 95% or more of their income on necessities — up from 23% in 2023. That sample is Bank of America's own customers, not a survey of the country, so it is a signal about the bank's depositors rather than a national rate. Among lower-income households in that sample the share is higher still and keeps setting new highs in this series. For these families, discretionary spending is no longer a category. Necessities are taking everything.
The driver is visible in The K-Shape: lower-income wages are growing well below inflation, while higher-income households see wage growth that runs comfortably ahead of prices. The K-shaped recovery has become a permanent feature of the economy rather than a temporary post-pandemic artifact.
When nearly every dollar is spoken for, any unexpected expense becomes a crisis. The Buffer shows the personal savings rate well below its pre-pandemic average, and The $400 Test confirms that more than a third of Americans still cannot cover even a minor emergency with cash. These are three views of the same squeeze.
Explore Further
Is this happening to you?
Do you run out of money before your next paycheck arrives?
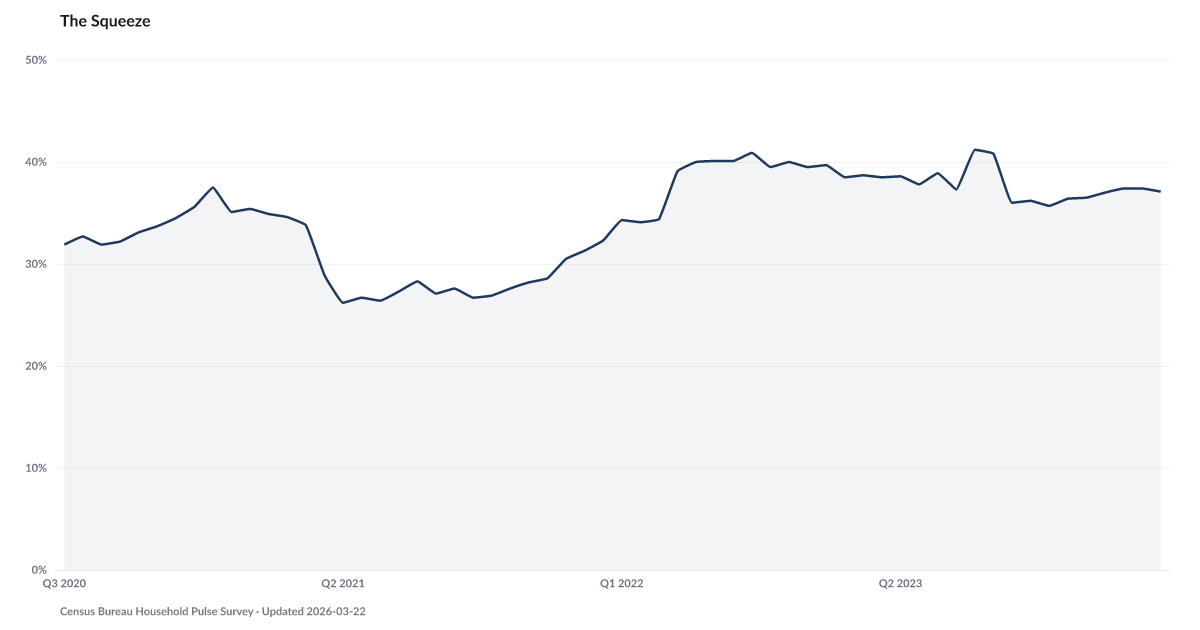
How has The Squeeze changed over time?

Most affected counties
Counties with the highest safety net and buffer scores in the County Distress Index.
Explore all 3,144 counties →| Period | Value | YoY Change |
|---|---|---|
| 2025 | 24% | +0.3 pp |
| 2024 | 23.7% | +0.7 pp |
| 2023 | 23% | — |
Frequently Asked Questions
What share of Americans spend nearly all their income on necessities?
This figure is not a national rate. Bank of America Institute measures it inside its own deposit data: nearly 24% of the households in its checking-account sample spend 95% or more of their income on necessities. Among lower-income households in that sample, the figure was 29% in the 2025 analysis. These households have virtually no discretionary spending or savings capacity remaining.
Is the income-to-necessity ratio getting worse?
Yes, inside Bank of America's checking-account sample. The share spending 95%+ on necessities rose from 23% in 2023 to nearly 24% in 2025. Among lower-income households in that sample, the published figure climbed from 27.1% in 2023 to 29% in 2025. Bank of America prints the earlier readings only as chart bars, so treat the year-to-year steps as approximate. The trend is driven by essential costs (groceries, housing, insurance) rising faster than wages for lower-income workers.
Why do households have no margin even when employment is high?
The pressure is coming from the cost side, not employment. Lower-income wage growth is approximately 1%, leaving less room to absorb increases in essential costs. Higher-income households see approximately 4% wage growth and have more room to absorb those costs — creating a K-shaped divergence that employment statistics can mask.
How does this connect to savings and debt indicators?
When nearly every dollar is consumed by necessities, there is nothing left to save or to use for debt repayment. This directly explains why the personal savings rate has fallen to 2.7%, why 37% of adults can't cover a $400 emergency, and why 6% of 401(k) participants are taking hardship withdrawals. These are not separate problems — they are three views of the same squeeze.
Where does the income-to-necessity spending data come from?
Bank of America Institute analyzes aggregated and anonymized internal depositor transaction data to measure household spending patterns. The sample is households that have held a U.S. Bank of America checking account for at least a year, whose payments the bank can observe, and who appear to bank primarily with Bank of America. Bank of America does not publish its size. That makes it a large, near-real-time read on the bank's own customers rather than a sample of the country, so the share it reports should not be read as a U.S. household rate.


Quick poll
Is this affecting you or your household?
Discussion
Get the numbers when they move.
New data drops, indicator updates, and ADI score changes — delivered when it matters. No spam.
or Create an Account for full access
Loading comments…