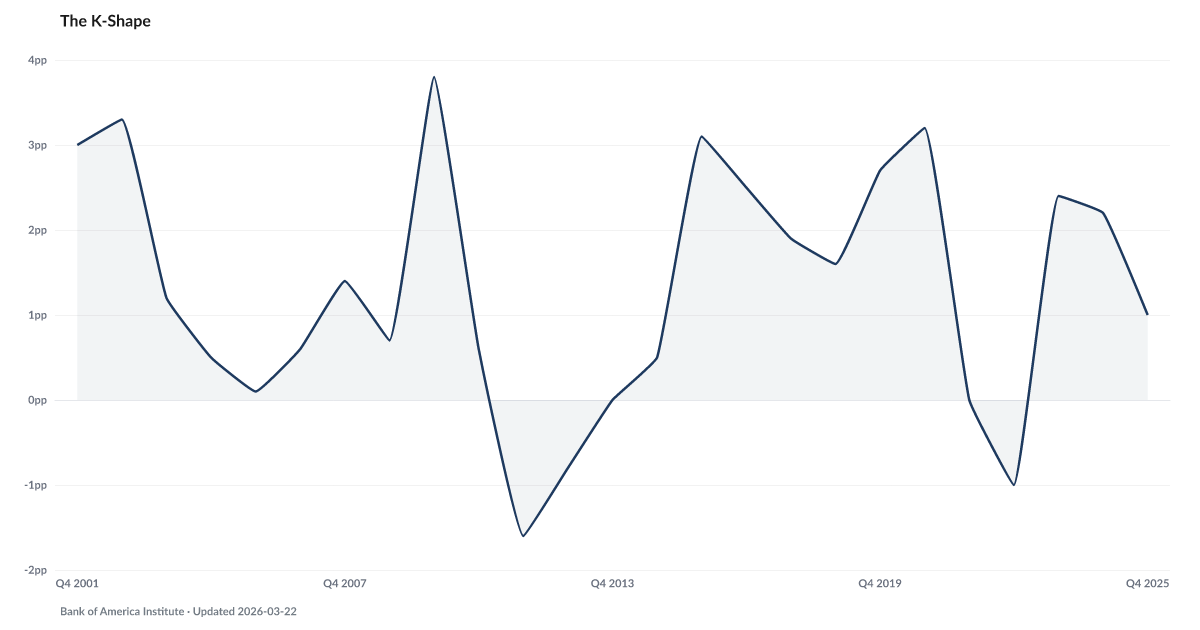
The K-Shape
Gap between lower-income wage growth and inflation
Historically follows Wage Growth vs CPI Spread by 2 quarters — no active signal. Wage Growth vs CPI Spread · View projections
What is the current K-Shape reading?
Lower-Income Wage Growth vs. Inflation Gap: 2.2 percentage points as of 2024, and improving. Source: Computed from Federal Reserve Bank of Atlanta Wage Growth Tracker and U.S. Bureau of Labor Statistics Consumer Price Index.
The gap between what higher-income and lower-income workers earn has widened to levels not seen since 2016, and the lower end is falling behind prices.
The Atlanta Fed Wage Growth Tracker for the bottom income quartile, minus the headline CPI inflation rate, sits at 2.2 percentage points in 2024. That is the gap between what lower-income workers' wages are growing at and what prices are growing at. Higher-income wage growth has comfortably outpaced inflation through the same period. The gap between the two groups widened sharply in 2022 and has remained wide since.
This divergence is the mechanism behind what shows up in other indicators as household distress. The Squeeze tracks the share of U.S. households spending nearly all of their income on necessities, and that share has stepped up year over year since 2023. When wages at the bottom of the distribution grow more slowly than essential costs, the shortfall does not appear as a recession. It appears as slowly deepening pressure on lower-income households.
The economic recovery from 2020 onward was initially described as K-shaped — a temporary phenomenon expected to resolve as the labor market tightened. Five years later, the K has become structural. Pink Slips announcements have stepped back up, disproportionately affecting lower-wage workers in government and support functions. And The Warning Light — running below the Conference Board's recession threshold — suggests the pressure is more likely to deepen than ease.
Explore Further
Is this happening to you?
Has your raise kept up with what you're actually paying for rent, food, and insurance?
How has The K-Shape changed over time?

Most affected counties
Counties with the highest labor scores in the County Distress Index.
Explore all 3,144 counties →| Period | Value | YoY Change |
|---|---|---|
| 2024 | 2.2 pp | -0.2 pp |
| 2023 | 2.4 pp | +3.4 pp |
| 2022 | -1 pp | -1 pp |
| 2021 | 0 pp | -3.2 pp |
| 2020 | 3.2 pp | +0.5 pp |
| 2019 | 2.7 pp | +1.1 pp |
| 2018 | 1.6 pp | -0.3 pp |
| 2017 | 1.9 pp | -0.6 pp |
| 2016 | 2.5 pp | -0.6 pp |
| 2015 | 3.1 pp | +2.6 pp |
| 2014 | 0.5 pp | +0.5 pp |
| 2013 | 0 pp | +0.8 pp |
Frequently Asked Questions
What is Lower-Income Wage Growth vs. Inflation Gap?
Gap between lower-income wage growth and inflation
Why does Lower-Income Wage Growth vs. Inflation Gap matter for financial distress?
Lower-Income Wage Growth vs. Inflation Gap is one of the indicators tracked by the American Distress Index (ADI), which measures five dimensions of U.S. household financial distress: Delinquency, Default & Legal, Debt Burden, Labor, and Safety Net & Buffer. Changes in this indicator contribute to the overall distress picture.
Where does the Lower-Income Wage Growth vs. Inflation Gap data come from?
This data comes from Computed from Federal Reserve Bank of Atlanta Wage Growth Tracker and U.S. Bureau of Labor Statistics Consumer Price Index. More information: https://www.atlantafed.org/research-and-data/data/wage-growth-tracker, https://www.bls.gov/cpi/. The American Distress Index updates this indicator annually.


Quick poll
Is this affecting you or your household?
Discussion
Get the numbers when they move.
New data drops, indicator updates, and ADI score changes — delivered when it matters. No spam.
or Create an Account for full access
Loading comments…