Wage Growth vs CPI Spread
Difference between wage growth and the overall Consumer Price Index
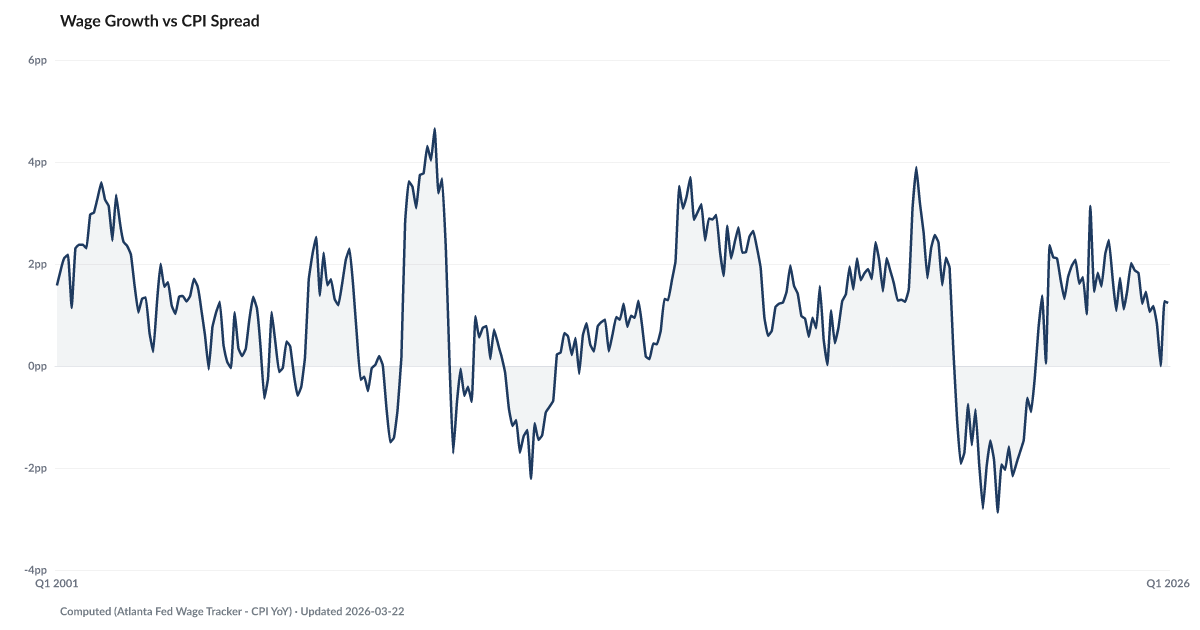
What is the current Wage Growth vs CPI Spread?
The wage growth vs CPI spread stood at -0.6 points in April 2026 — meaning nominal wage growth exceeds CPI inflation by this margin. When positive, workers are gaining purchasing power; when negative, wages are losing ground to prices. Source: Atlanta Fed Wage Growth Tracker minus BLS CPI YoY.
Wage growth minus inflation sits at -0.6 points. The gap between what workers earn and what prices take has hovered near zero since the post-pandemic recovery — on both sides of the line.
Real wage growth is the simplest test of whether work is paying off. Take nominal wage growth from the Atlanta Fed tracker. Subtract the CPI year-over-year rate. What's left is the change in purchasing power.
For most of 2022, the spread was negative. Wages were rising. Prices were rising faster. Workers were losing ground every month. That phase ended in early 2023. The spread went positive and stayed there. It peaked above 1.5 percentage points. That was the period during which real wages finally caught up to cumulative price shocks.
The cushion has thinned to almost nothing. As of April 2026, the wage-growth-minus-CPI spread sits at -0.6 points. The spread brushed zero in late 2025 and has stayed close to it since, drifting just above and just below the line. The Grocery Gap shows a parallel compression on food specifically.
A spread this close to zero — on either side of it — does not close the cumulative hole from the 2021-2023 inflation run. Whether workers gain or lose ground in a given month, the accumulated gap in real purchasing power has not reversed. The Buffer, the personal savings rate, sits near historic lows for a reason. The month-to-month spread is a rounding error now. The level of prices is still where it is.
Explore Further
Is this happening to you?
Is your paycheck keeping up with what you actually spend each month?
How has Wage Growth vs CPI Spread changed over time?

Most affected counties
Counties with the highest debt burden scores in the County Distress Index.
Explore all 3,144 counties →| Period | Value | YoY Change |
|---|---|---|
| Apr 2026 | -0.58 pts | −2.5 pts |
| Mar 2026 | 0.51 pts | −1.5 pts |
| Feb 2026 | 1.47 pts | −0.0 pts |
| Jan 2026 | 1.71 pts | +0.6 pts |
| Dec 2025 | 0.35 pts | −1.4 pts |
| Nov 2025 | 1.1 pts | +0.0 pts |
| Sep 2025 | 1.18 pts | −1.3 pts |
| Aug 2025 | 1.06 pts | −1.1 pts |
| Jul 2025 | 1.46 pts | −0.1 pts |
| Jun 2025 | 1.22 pts | −0.6 pts |
| May 2025 | 1.82 pts | +0.4 pts |
| Apr 2025 | 1.87 pts | −1.3 pts |
Frequently Asked Questions
What is the wage-CPI spread?
The wage-CPI spread measures the gap between nominal wage growth and CPI inflation. The April 2026 reading is -0.6 points — wages are currently growing faster than prices, a positive sign for household purchasing power.
Why does the wage-CPI spread matter?
When inflation outpaces wages (negative spread), households lose purchasing power and must dip into savings or take on debt to maintain living standards. The spread is a derived difference, so it is not an input to the American Distress Index; American Default Research tracks it alongside the index as cost-of-living context.
Where does this data come from?
Computed from the Atlanta Fed Wage Growth Tracker (median wage growth) minus BLS CPI year-over-year inflation.

Quick poll
Is this affecting you or your household?
Discussion
Get the numbers when they move.
New data drops, indicator updates, and ADI score changes — delivered when it matters. No spam.
or Create an Account for full access
Loading comments…