The Coverage Tax
Gap between auto insurance inflation and the overall Consumer Price Index
What is the current The Coverage Tax?
Health insurance costs are running 2.0 points above core CPI in May 2026. The Coverage Tax measures this gap — how much faster insurance premiums are climbing compared to general consumer prices. When insurance outpaces inflation, households absorb the difference through higher premiums, deductibles, or coverage trade-offs. Source: BLS health insurance CPI minus core CPI.
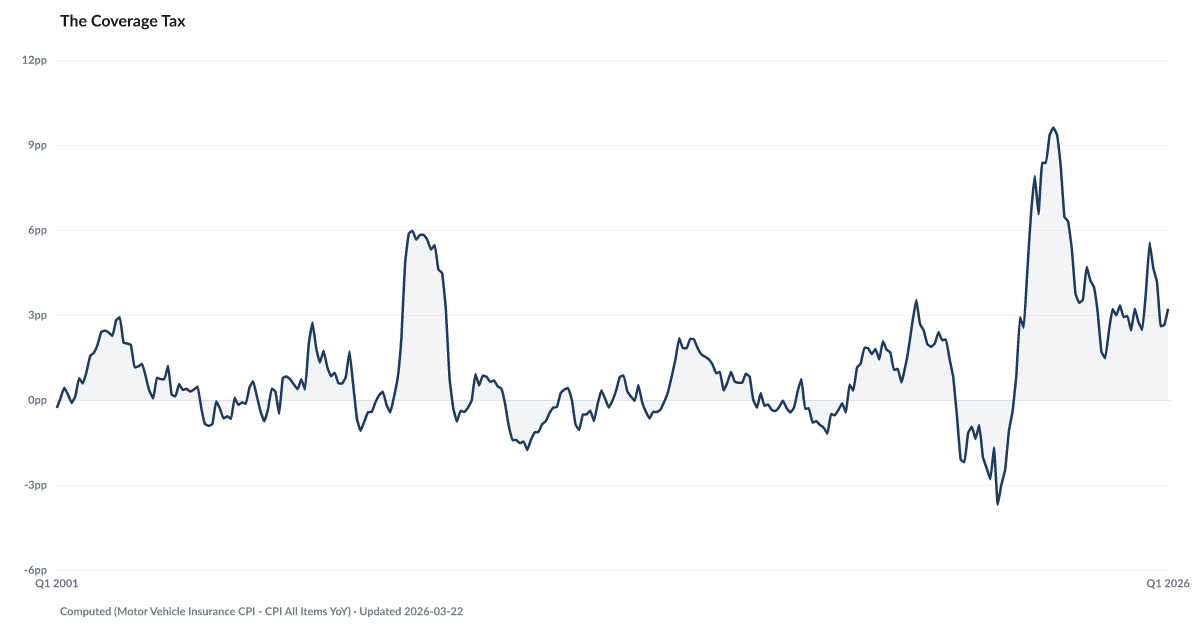
Car insurance inflation minus the overall Consumer Price Index sits at 2 points. Auto coverage is a bill drivers cannot legally skip — this is how its price tracks against everything else.
Before the pandemic, auto insurance premiums ran roughly a point or less above headline inflation in most years, according to BLS data. Under one percentage point was the normal spread. That premium was boring. Predictable. A slow tax on the cost of driving that nobody paid attention to.
Then it broke. The gap hit 9.6 percentage points in mid-2023, wider than the rest of the site series outside the Great Financial Crisis. It fell through most of 2024, then climbed again from the summer of 2025. As of May 2026, auto insurance inflation runs 2 points against the overall CPI.
This matters because auto insurance is not optional. Forty-nine states require it to legally drive to work. For households already stretched thin on The Buffer, how far auto coverage runs against headline inflation — 2 points as of May 2026 — is the difference between making rent and missing it. The Repo Line shows why: auto loan serious delinquency is climbing in parallel with the insurance surcharge. People keep the car running on borrowed time, then lose it.
The cool-downs are misleading. The 2024 dip was a pause inside a longer climb. Normal never came back. The pre-pandemic norm of roughly one point above headline used to be the ceiling. It is now the lower bound.
Explore Further
Is this happening to you?
Has your auto insurance premium jumped even though your driving record hasn't changed?
How has The Coverage Tax changed over time?

Most affected counties
Counties with the highest debt burden scores in the County Distress Index.
Explore all 3,144 counties →| Period | Value | YoY Change |
|---|---|---|
| May 2026 | 1.96 pts | −0.8 pts |
| Apr 2026 | 1.37 pts | −1.9 pts |
| Mar 2026 | 2.77 pts | +0.3 pts |
| Feb 2026 | 3.19 pts | +0.2 pts |
| Jan 2026 | 2.56 pts | −0.4 pts |
| Dec 2025 | 2.72 pts | −0.6 pts |
| Nov 2025 | 4.25 pts | +1.3 pts |
| Sep 2025 | 4.65 pts | +2.2 pts |
| Aug 2025 | 5.56 pts | +4.1 pts |
| Jul 2025 | 3.8 pts | +2.1 pts |
| Jun 2025 | 2.47 pts | −0.6 pts |
| May 2025 | 2.75 pts | −1.2 pts |
Frequently Asked Questions
What is The Coverage Tax?
The Coverage Tax measures how much faster health insurance costs rise compared to core CPI. The May 2026 reading is 2.0 points above core CPI — insurance premiums are outpacing general inflation.
Why does this matter?
Rising insurance costs reduce take-home pay and increase out-of-pocket medical expenses, contributing to the cost pressure the American Distress Index tracks.
Where does this data come from?
Derived from BLS health insurance CPI data compared to core CPI.

Quick poll
Is this affecting you or your household?
Discussion
Get the numbers when they move.
New data drops, indicator updates, and ADI score changes — delivered when it matters. No spam.
or Create an Account for full access
Loading comments…