CPI Inflation Rate (All Items)
Year-over-year change in consumer prices
Validated leading indicator for Motor Vehicle Insurance CPI (3q lag) — currently dormant. Motor Vehicle Insurance CPI · View projections
What is the current CPI Inflation Rate (All Items)?
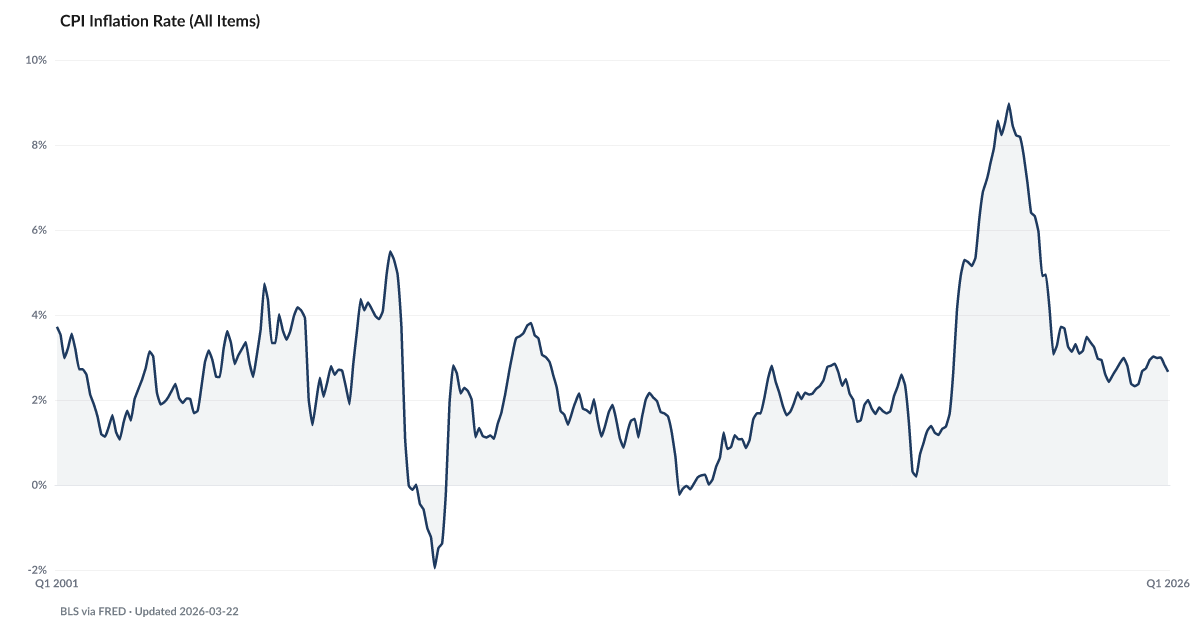
The Consumer Price Index (CPI) for all items rose 4.2% year-over-year in May 2026, according to the Bureau of Labor Statistics. While headline inflation has moderated from its 2022 peak, cumulative price increases since 2020 continue to strain household budgets — especially for food, shelter, and healthcare. Source: BLS via FRED (CPIAUCSL).
Headline CPI is running at 4.2% in May 2026. Still above the Fed's 2 percent target after multiple consecutive years of overshoot, compounding on price levels already well above 2020.
The year-over-year inflation rate is the number Wall Street watches. It's the number the Fed talks about. It's the number that shows up in every headline. At 4.2% in May 2026, it reads as well off its 2022 high of 9.0 percent but still above the Fed's 2 percent target.
The price level is the number households pay. Cumulative prices are well up from January 2020, according to BLS data. That accumulation does not reverse. Inflation cooling means prices grow more slowly from here. It does not mean a 2019 grocery bill is coming back.
Multiple years of overshooting matters because it changes how households think about their own budgets. A decade of 2 percent inflation is a background condition. Several consecutive years of 3 percent or higher is a running shortfall in real wages for every household whose nominal pay didn't keep up. The Buffer at near historic lows and The Squeeze, which tracks the share of households spending nearly all of income on necessities, are both consequences of this overshoot.
The rate cooling is real, but the relief is not. Households are not getting back what the 2021-2023 inflation took. They are watching the rate of loss slow down while the cumulative hole stays where it is.
Explore Further
How has CPI Inflation Rate (All Items) changed over time?

Most affected counties
Counties with the highest debt burden scores in the County Distress Index.
Explore all 3,144 counties →| Period | Value | YoY Change |
|---|---|---|
| May 2026 | 4.17% | +1.8 pts |
| Apr 2026 | 3.78% | +1.5 pts |
| Mar 2026 | 3.29% | +0.9 pts |
| Feb 2026 | 2.43% | −0.4 pts |
| Jan 2026 | 2.39% | −0.6 pts |
| Dec 2025 | 2.65% | −0.2 pts |
| Nov 2025 | 2.7% | −0.0 pts |
| Sep 2025 | 3.02% | +0.6 pts |
| Aug 2025 | 2.94% | +0.3 pts |
| Jul 2025 | 2.74% | −0.2 pts |
| Jun 2025 | 2.68% | −0.3 pts |
| May 2025 | 2.38% | −0.9 pts |
Frequently Asked Questions
What is the current CPI inflation rate?
The all-items CPI inflation rate was 4.2% year-over-year in the May 2026 BLS reading. This measures the average change in prices paid by urban consumers for a market basket of goods and services.
Why does CPI matter for financial distress?
Even moderate inflation erodes purchasing power. The American Distress Index tracks the cumulative impact: shelter remains the largest fixed cost in the CPI basket, and food and energy prices continue to swing on terms households cannot control.
Where does CPI data come from?
Published monthly by the Bureau of Labor Statistics, available via FRED series CPIAUCSL.

Quick poll
Is this affecting you or your household?
Discussion
Get the numbers when they move.
New data drops, indicator updates, and ADI score changes — delivered when it matters. No spam.
or Create an Account for full access
Loading comments…