The Grocery Gap
Gap between average hourly earnings growth and food-at-home inflation
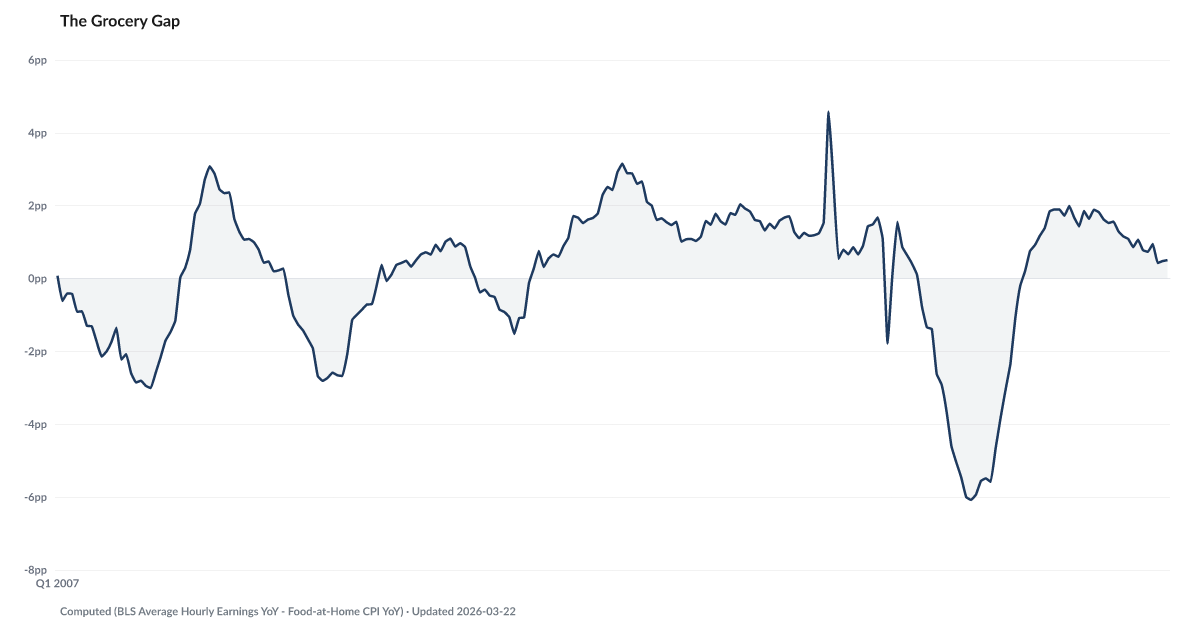
What is the current The Grocery Gap?
Wage growth is running 0.4 percentage points ahead of food-at-home CPI in the latest reading — a sliver of cushion that has narrowed from a roughly 1.3pp lead a year earlier. The Grocery Gap measures this spread between average hourly earnings growth and food-at-home inflation; when positive, paychecks are gaining ground on grocery prices, when negative, food is outpacing wages. Source: BLS (Average Hourly Earnings minus Food-at-Home CPI).
The gap between wage growth and grocery inflation has narrowed to 0.4 points as of May 2026 — the thinnest margin since food prices started climbing again in late 2024.
For a long stretch of 2023 and 2024, groceries were the one part of the household budget where workers were catching up. Wage growth ran more than a full point ahead of food-at-home CPI. The lead peaked near +1.5 percentage points. Grocery prices had already done their damage, and earnings were finally gaining ground.
That cushion has nearly closed. BLS data shows the Grocery Gap tightened to 0.4 points in May 2026. Food prices are reaccelerating. Wages are still growing, but not fast enough to keep the daylight visible.
A thin lead is not a win. It means the average hourly earner is treading water on one of the most frequent transactions in their budget. For households where grocery spending consumes a larger share of the paycheck, which is most households in the lower-income side of the distribution, the cushion closed much earlier and much harder.
Grocery Prices Cumulative Change Since Jan 2020 tells the other side of this story. Food prices have climbed substantially since the start of 2020 and continue to drift higher most months. The annual rate cooling and then reaccelerating doesn't reverse that accumulation. It just restarts it.
Explore Further
Is this happening to you?
Are you spending more on groceries even though you're buying less?
How has The Grocery Gap changed over time?

Most affected counties
Counties with the highest debt burden scores in the County Distress Index.
Explore all 3,144 counties →| Period | Value | YoY Change |
|---|---|---|
| May 2026 | 0.37 pts | −0.7 pts |
| Apr 2026 | 0.35 pts | −0.8 pts |
| Mar 2026 | 0.69 pts | −0.6 pts |
| Feb 2026 | 0.56 pts | −1.0 pts |
| Jan 2026 | 0.72 pts | −0.8 pts |
| Dec 2025 | 0.69 pts | −0.9 pts |
| Nov 2025 | 1.31 pts | −0.5 pts |
| Sep 2025 | 0.73 pts | −0.9 pts |
| Aug 2025 | 0.78 pts | −1.1 pts |
| Jul 2025 | 1.07 pts | −0.4 pts |
| Jun 2025 | 0.86 pts | −0.8 pts |
| May 2025 | 1.09 pts | −0.9 pts |
Frequently Asked Questions
What is The Grocery Gap?
It measures the spread between average hourly earnings growth and food-at-home CPI inflation. The latest reading is roughly 0.4 percentage points, meaning wages are barely outpacing grocery prices.
Why does the grocery gap matter?
Food is non-discretionary. When the gap narrows or turns negative, lower-income households — who spend 25-35% of income on food — see groceries eat a larger share of every paycheck.
Where does this data come from?
Computed from BLS Average Hourly Earnings (CES0500000003) year-over-year change minus Food-at-Home CPI (CUSR0000SAF11) year-over-year change.

Quick poll
Is this affecting you or your household?
Discussion
Get the numbers when they move.
New data drops, indicator updates, and ADI score changes — delivered when it matters. No spam.
or Create an Account for full access
Loading comments…