Grocery Prices Cumulative Change Since Jan 2020
Cumulative percentage change in grocery prices since January 2020
What is the current Grocery Prices Cumulative Change Since Jan 2020?
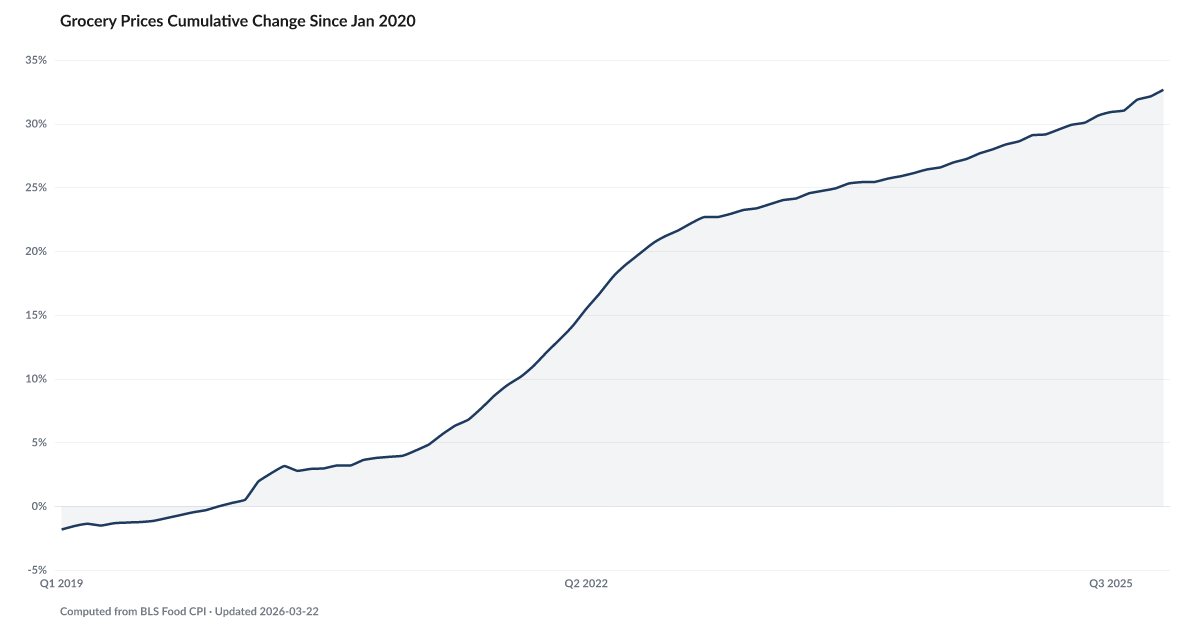
Grocery Prices Cumulative Change Since Jan 2020: 33.53% as of 2026-05, and worsening. Source: Computed from BLS Food CPI.
Grocery prices are 33.5% higher than they were in January 2020. And the cumulative damage keeps growing every single month.
There is a difference between the inflation rate and the price level. The rate is the change this year. The level is the total distance prices have traveled. Politicians and central bankers talk about the rate because the rate is what they can affect. Households pay the level.
BLS data shows grocery prices are 33.5% higher than they were in January 2020 as of May 2026. A weekly grocery trip from that month costs meaningfully more today. That is the cumulative reading, not the annual rate. The annual rate has cooled. The cumulative reading has not reversed and cannot reverse without outright deflation in food, which is not on the table.
The cumulative number is the one that explains why headline inflation coming down feels like gaslighting to anyone buying food. A 3 percent annual rate on top of a 33 percent accumulated increase is still the compounding of a permanent shock. The relief would have to come from wages pulling even, which shows up in The Grocery Gap. That gap has compressed to a thin positive margin between wage growth and food inflation.
Every month adds more. The chart doesn't have a turning point. It has a line that keeps climbing.
Explore Further
Is this happening to you?
Does your grocery bill feel permanently higher than it was before 2020?
How has Grocery Prices Cumulative Change Since Jan 2020 changed over time?

Most affected counties
Counties with the highest debt burden scores in the County Distress Index.
Explore all 3,144 counties →| Period | Value | YoY Change |
|---|---|---|
| May 2026 | 33.53% | +4.0 pts |
| Apr 2026 | 33.32% | +4.2 pts |
| Mar 2026 | 32.65% | +3.5 pts |
| Feb 2026 | 32.66% | +4.0 pts |
| Jan 2026 | 32.14% | +3.8 pts |
| Dec 2025 | 31.89% | +3.9 pts |
| Nov 2025 | 31.04% | +3.4 pts |
| Sep 2025 | 30.92% | +4.0 pts |
| Aug 2025 | 30.63% | +4.1 pts |
| Jul 2025 | 30.08% | +3.7 pts |
| Jun 2025 | 29.92% | +3.8 pts |
| May 2025 | 29.54% | +3.6 pts |
Frequently Asked Questions
What is Grocery Prices Cumulative Change Since Jan 2020?
Cumulative percentage change in grocery prices since January 2020
Why does Grocery Prices Cumulative Change Since Jan 2020 matter for financial distress?
Grocery Prices Cumulative Change Since Jan 2020 is one of the indicators tracked by the American Distress Index (ADI), which measures five dimensions of U.S. household financial distress: Delinquency, Default & Legal, Debt Burden, Labor, and Safety Net & Buffer. Changes in this indicator contribute to the overall distress picture.
Where does the Grocery Prices Cumulative Change Since Jan 2020 data come from?
This data comes from Computed from BLS Food CPI. More information: https://fred.stlouisfed.org/series/CUSR0000SAF11. The American Distress Index updates this indicator monthly.

Quick poll
Is this affecting you or your household?
Discussion
Get the numbers when they move.
New data drops, indicator updates, and ADI score changes — delivered when it matters. No spam.
or Create an Account for full access
Loading comments…