Total Revolving Credit Outstanding
Total revolving credit (primarily credit cards) outstanding
What is the current Total Revolving Credit Outstanding reading?
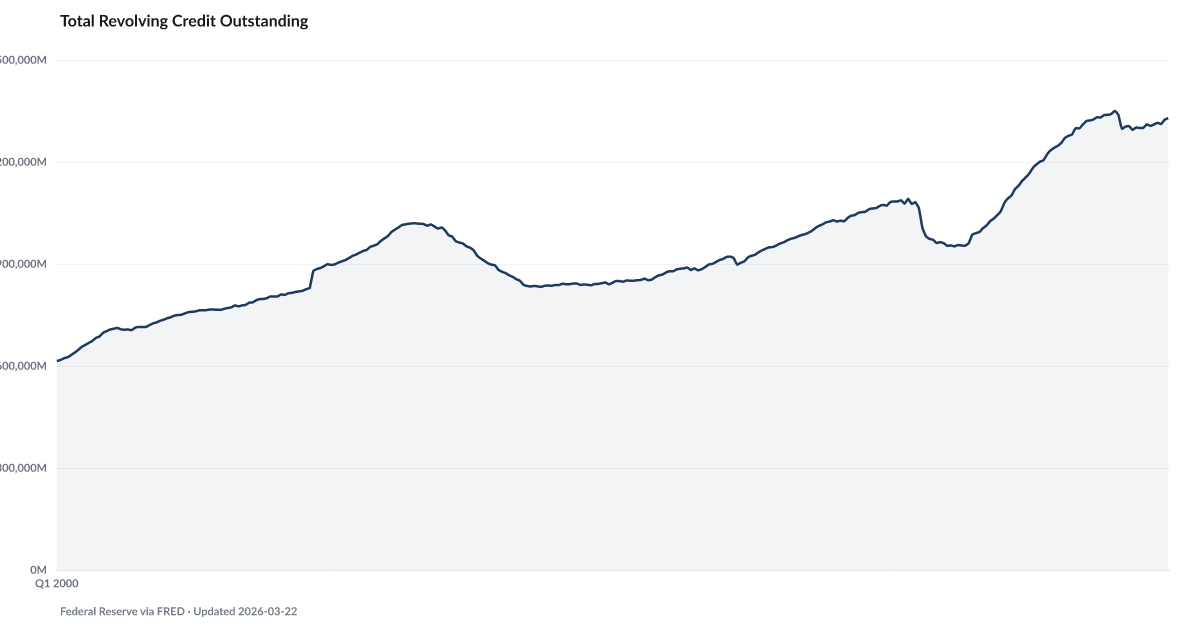
Total revolving credit outstanding — primarily credit card balances — reached $1.35 trillion as of June 2026, according to the Board of Governors of the Federal Reserve System's G.19 Statistical Release. Growth in revolving credit alongside a credit card APR near 20.94% signals that households are increasingly relying on high-cost borrowing to cover expenses rather than paying from income or savings.
Revolving credit balances reached $1.4 trillion in October 2024 and remain roughly flat vs that level.
The Federal Reserve's revolving credit series, FRED REVOLSL, tracks credit cards and other revolving consumer loans. The series sits well above the December 2019 reading of $1.09 trillion — most of that growth concentrated since early 2022, when balances began climbing quarter after quarter. The current June 2026 reading is roughly flat vs the October 2024 reference reading.
Revolving credit balances can carry high interest costs, but this page's Federal Reserve series measures dollars outstanding, not card APRs. The separate The Card Tax indicator tracks the Federal Reserve's credit-card interest-rate series. Unlike a mortgage or an auto loan, a credit-card balance is open-ended. A household that can't pay in full in a given month carries it to the next one and accrues interest at the card's rate — regardless of what the Fed has done to the overnight rate.
The composition of the growth matters. Some of it is the natural drift of a growing economy. More of it is households using revolving credit to bridge gaps income isn't closing on its own. When the savings rate runs near historic lows and essential costs keep rising, the card becomes the month-to-month balancing line.
Read revolving credit alongside Falling Behind, Revolving Credit Utilization 75Th Percentile, and The Safety Net as separate measures. The Safety Net does not show what non-savings respondents used or predict what happens after available credit is exhausted.
Explore Further
How has Total Revolving Credit Outstanding changed over time?

Most affected counties
Counties with the highest safety net and buffer scores in the County Distress Index.
Explore all 3,144 counties →| Period | Value | YoY Change |
|---|---|---|
| Jun 2026 | $1.3511T | +$49.327B |
| May 2026 | $1.3443T | +$44.1039B |
| Apr 2026 | $1.3496T | +$50.2189B |
| Mar 2026 | $1.338T | +$45.1568B |
| Feb 2026 | $1.3272T | +$23.0245B |
| Jan 2026 | $1.3261T | +$24.1479B |
| Dec 2025 | $1.3243T | +$27.3567B |
| Nov 2025 | $1.3163T | -$25.7543B |
| Oct 2025 | $1.3171T | -$35.3559B |
| Sep 2025 | $1.3127T | -$29.7674B |
| Aug 2025 | $1.3083T | -$31.8728B |
| Jul 2025 | $1.3103T | -$27.2032B |
Frequently Asked Questions
What is revolving credit?
Revolving credit is debt that can be borrowed against repeatedly up to a credit limit — mainly credit cards and home equity lines of credit. Unlike an installment loan with a fixed schedule, a revolving balance rises and falls with spending and repayment.
Why does revolving credit growth matter?
When revolving credit grows alongside a credit card APR near 20.94% and depleted savings, it signals households are borrowing to cover expenses they cannot pay from income or savings. That is distress-driven borrowing, not discretionary spending.
Where does the data come from?
The Federal Reserve publishes revolving credit data monthly in its G.19 Statistical Release. The June 2026 reading is $1.35 trillion. American Default tracks both the total outstanding balance and narrower cuts like credit-card-only balances and utilization by percentile.


Quick poll
Is this affecting you or your household?
Discussion
Get the numbers when they move.
New data drops, indicator updates, and ADI score changes — delivered when it matters. No spam.
or Create an Account for full access
Loading comments…