Food and Beverages CPI
Year-over-year change in food and beverage prices
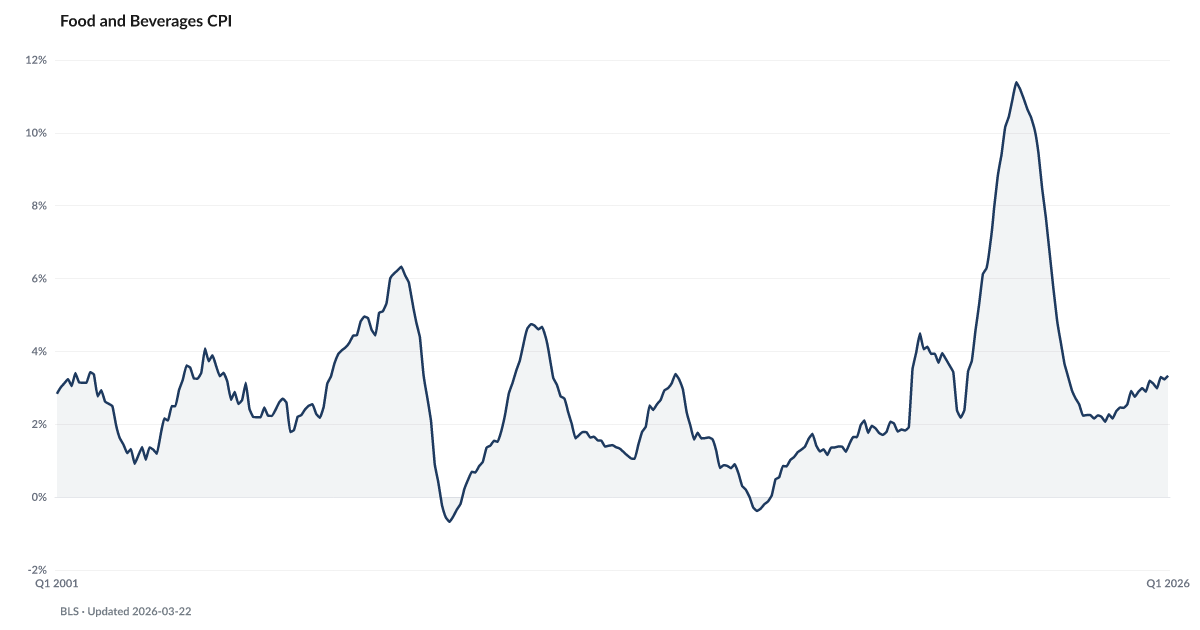
What is the current Food and Beverages CPI?
The food-at-home Consumer Price Index rose 3.1% year-over-year in May 2026, according to the Bureau of Labor Statistics. Grocery prices have outpaced overall inflation cumulatively since 2020, even as the year-over-year rate has moderated. Source: BLS CPI (CUSR0000SAF1).
Food and beverage inflation is running at 3.1%. It lands on top of years of grocery-price increases that never reversed.
Food inflation fell hard through 2023 and most of 2024. The year-over-year rate dipped as low as 2.1 percent in August 2024, the softest food-and-beverages print since 2021. For a moment it looked like the grocery aisle had finally caught up to the rest of the disinflation story.
It reversed. BLS data shows food and beverage CPI back above 3 percent as of May 2026, and the trajectory through late 2025 was a steady climb. Whatever cooling was in the pipeline has stopped. Dairy, beef, and coffee categories have all re-accelerated. Processing costs and the new tariff regime tracked in The Import Tax are both feeding through.
The annual rate cooling and then climbing does not reverse what the cumulative damage has done. Grocery Prices Cumulative Change Since Jan 2020 sits at 32.6 percent. Households are not paying 2020 prices. They are paying 2026 prices, which are now climbing again at a pace above overall inflation.
The Grocery Gap shows the combined effect. Wage growth is running just 0.4 percentage points ahead of food-at-home inflation. That cushion was wider a year ago. It is narrowing as food prices reaccelerate. The reacceleration is doing most of the work.
Explore Further
How has Food and Beverages CPI changed over time?

Most affected counties
Counties with the highest debt burden scores in the County Distress Index.
Explore all 3,144 counties →| Period | Value | YoY Change |
|---|---|---|
| May 2026 | 3.08% | +0.2 pts |
| Apr 2026 | 3.22% | +0.5 pts |
| Mar 2026 | 2.75% | −0.2 pts |
| Feb 2026 | 3.14% | +0.6 pts |
| Jan 2026 | 2.93% | +0.5 pts |
| Dec 2025 | 3.04% | +0.6 pts |
| Nov 2025 | 2.62% | +0.3 pts |
| Sep 2025 | 3.11% | +0.8 pts |
| Aug 2025 | 3.2% | +1.1 pts |
| Jul 2025 | 2.89% | +0.7 pts |
| Jun 2025 | 2.99% | +0.7 pts |
| May 2025 | 2.9% | +0.7 pts |
Frequently Asked Questions
How fast are grocery prices rising?
Food-at-home prices rose 3.1% year-over-year in the May 2026 BLS report. Cumulatively, grocery prices remain meaningfully higher than their pre-pandemic level.
Why does food inflation matter for financial distress?
Food is non-discretionary spending. When grocery costs rise faster than wages, households must cut other spending or take on debt to eat — a direct driver of the financial distress the ADI tracks.
Where does food CPI data come from?
Published monthly by the Bureau of Labor Statistics as part of the CPI report, series CUSR0000SAF1 (food at home).

Quick poll
Is this affecting you or your household?
Discussion
Get the numbers when they move.
New data drops, indicator updates, and ADI score changes — delivered when it matters. No spam.
or Create an Account for full access
Loading comments…