The Import Tax
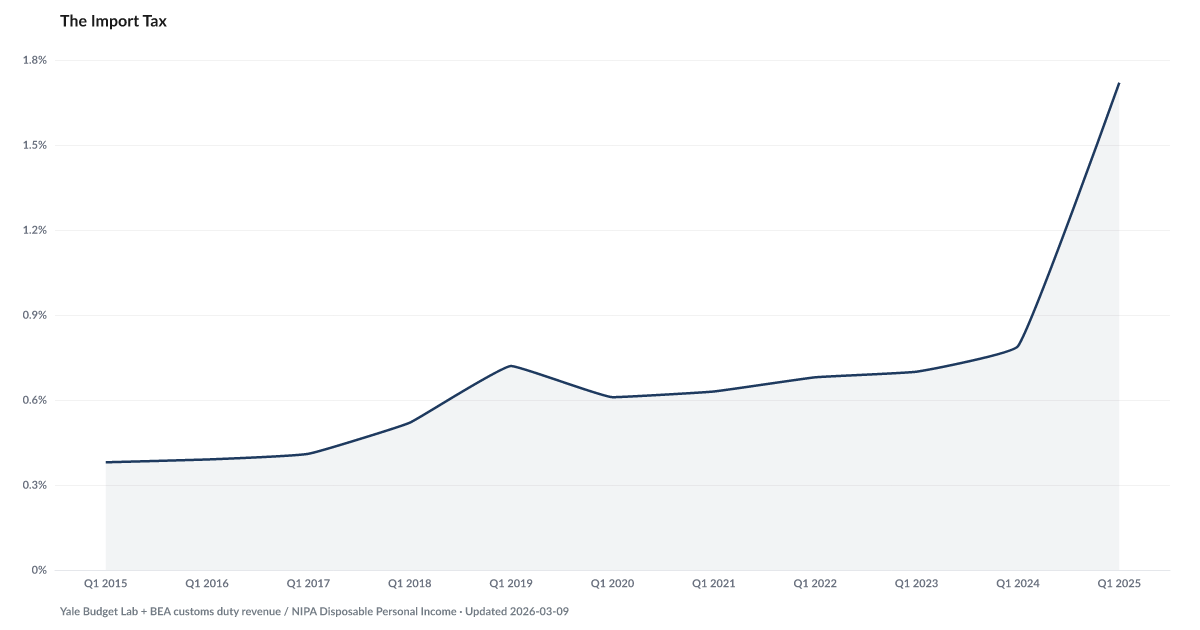
Estimated tariff cost as a share of household disposable income
What is the current The Import Tax?
Import prices rose 1.7% year-over-year in the latest reading. The Import Tax tracks how trade costs — tariffs, shipping, and foreign exchange — flow through to consumer prices. Rising import costs are effectively a hidden tax on consumers, particularly for goods-heavy categories like electronics, clothing, and building materials. Source: BLS.
Estimated tariff costs absorbed 1.7% of U.S. household disposable income in 2025. That is 2.5× the 0.7 percent level that had held for the prior five years.
Tariffs are paid by importers at the border. Their economic incidence falls on consumers and firms, proportional to how much of the cost passes through into retail prices. Yale Budget Lab estimates combined with BEA customs duty data and NIPA disposable income produce the household burden measure.
From 2019 through 2024, the burden hovered near 0.7 percent of disposable income. Meaningful, but steady. The 2025 escalation changed the number. The current reading is 1.7%, above the steady 2019–2024 band. In one year the burden moved sharply higher.
The weight is not evenly distributed. Yale Budget Lab analysis suggests the bottom income quintile now carries an estimated tariff burden of roughly 3 percent of disposable income, far above the pre-trade-war rate. Tariffs function as a regressive consumption tax because lower-income households spend a larger share of income on goods, especially imported goods, while higher-income households spend more on services.
This is the mechanism underneath several other indicators in the Cost Pressure set. Import-heavy goods move through CPI Inflation Rate. Auto parts and vehicles feed into The Coverage Tax. Groceries show up in The Grocery Gap. A tax of this size on everyday goods doesn't arrive as one line on a paycheck. It arrives spread across every receipt.
Explore Further
Is this happening to you?
Have your grocery or household costs gone up in ways that feel disconnected from inflation headlines?
How has The Import Tax changed over time?

Most affected counties
Counties with the highest debt burden scores in the County Distress Index.
Explore all 3,144 counties →| Period | Value | YoY Change |
|---|---|---|
| 2025 | 1.72% | +0.9 pts |
| 2024 | 0.79% | +0.1 pts |
| 2023 | 0.7% | +0.0 pts |
| 2022 | 0.68% | +0.1 pts |
| 2021 | 0.63% | +0.0 pts |
| 2020 | 0.61% | −0.1 pts |
| 2019 | 0.72% | +0.2 pts |
| 2018 | 0.52% | +0.1 pts |
| 2017 | 0.41% | +0.0 pts |
| 2016 | 0.39% | +0.0 pts |
| 2015 | 0.38% | — |
Frequently Asked Questions
What is The Import Tax?
The Import Tax tracks year-over-year changes in import prices. At 1.7%, it measures how much trade costs are increasing for goods entering the U.S.
Why do import prices matter for distress?
Rising import prices flow through to consumer goods, effectively acting as a hidden tax. Tariff increases amplify this effect, raising costs for everyday products.
Where does this data come from?
Published monthly by the Bureau of Labor Statistics as part of the Import/Export Price Indexes.

Quick poll
Is this affecting you or your household?
Discussion
Get the numbers when they move.
New data drops, indicator updates, and ADI score changes — delivered when it matters. No spam.
or Create an Account for full access
Loading comments…