Total Household Debt
Total outstanding U.S. household debt
What is the current Total Household Debt?
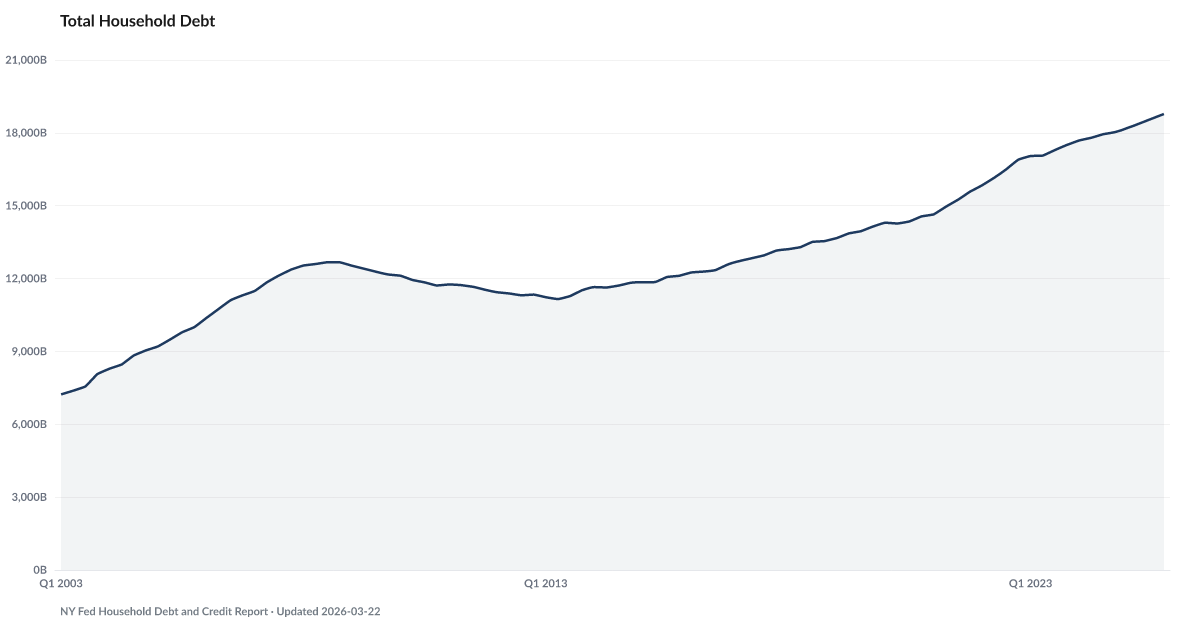
Total U.S. household debt — including mortgages, credit cards, auto loans, student loans, and HELOCs — reached $18.78 trillion as of Q4 2025, according to the New York Fed's Household Debt and Credit Report. This aggregate captures the full stock of what American households owe across all debt types. Source: NY Fed Household Debt and Credit Report.
Total U.S. household debt has reached $18775.7B. The current reading is a new high.
The New York Fed's Household Debt and Credit Report is the authoritative tally of what American households owe. The Q4 2025 reading is $18.78 trillion. The pre-pandemic Q4 2019 reading was $14.15 trillion. The cycle has added $4.6 trillion in five years, and the total has risen every single quarter since Q3 2021.
Mortgages still drive most of the dollar increase — roughly two-thirds of total household debt is housing. That is how it has always been. What has shifted is the rate at which the non-mortgage layers are growing.
Credit card balances are rising most rapidly in percentage terms. Auto loan balances are climbing on the back of higher vehicle prices and longer loan terms. HELOC balances have turned upward for the first time since the Great Recession. Heloc Balance Growth puts that reversal at the longest sustained increase since the 2004 to 2007 housing-equity boom.
A rising total by itself is not an alarm. Nominal GDP grows. Population grows. What matters is whether income and savings are keeping pace. The Buffer — the personal savings rate — is near historic lows. The Safety Net covers fewer households than in Bankrate's survey history. Debt is growing into reserves that are thinning, and Falling Behind is the indicator that picks up what happens when the gap closes.
Explore Further
How has Total Household Debt changed over time?

Most affected counties
Counties with the highest safety net and buffer scores in the County Distress Index.
Explore all 3,144 counties →| Period | Value | YoY Change |
|---|---|---|
| Q4 2025 | $18.8T | +$739.7B |
| Q3 2025 | $18.6T | +$642.0B |
| Q2 2025 | $18.4T | +$592.0B |
| Q1 2025 | $18.2T | +$516.0B |
| Q4 2024 | $18T | +$533.0B |
| Q3 2024 | $17.9T | +$652.0B |
| Q2 2024 | $17.8T | +$733.0B |
| Q1 2024 | $17.7T | +$640.0B |
| Q4 2023 | $17.5T | +$604.0B |
| Q3 2023 | $17.3T | +$786.0B |
| Q2 2023 | $17.1T | +$909.0B |
| Q1 2023 | $17T | +$1.2T |
Frequently Asked Questions
How much total debt do American households owe?
U.S. households owed $18.78 trillion as of Q4 2025, according to the New York Fed. This includes mortgages (the largest component), credit cards ($1.28 trillion), auto loans, student loans ($1.65 trillion), and HELOCs.
Is household debt at a record high?
Yes. Total household debt has reached new record highs in multiple consecutive quarters, driven by rising home prices (which increase mortgage balances) and record credit card accumulation. However, debt-to-income ratios matter more than the absolute dollar figure for assessing sustainability.
Where does household debt data come from?
The New York Fed publishes total household debt quarterly in its Household Debt and Credit Report, based on a nationally representative 5% sample of Equifax consumer credit reports. Data is broken down by debt type, age, geography, and delinquency status.

Quick poll
Is this affecting you or your household?
Discussion
Get the numbers when they move.
New data drops, indicator updates, and ADI score changes — delivered when it matters. No spam.
or Create an Account for full access
Loading comments…