The Search Signal
Up from 42 a year ago, what Americans are searching when they're in trouble
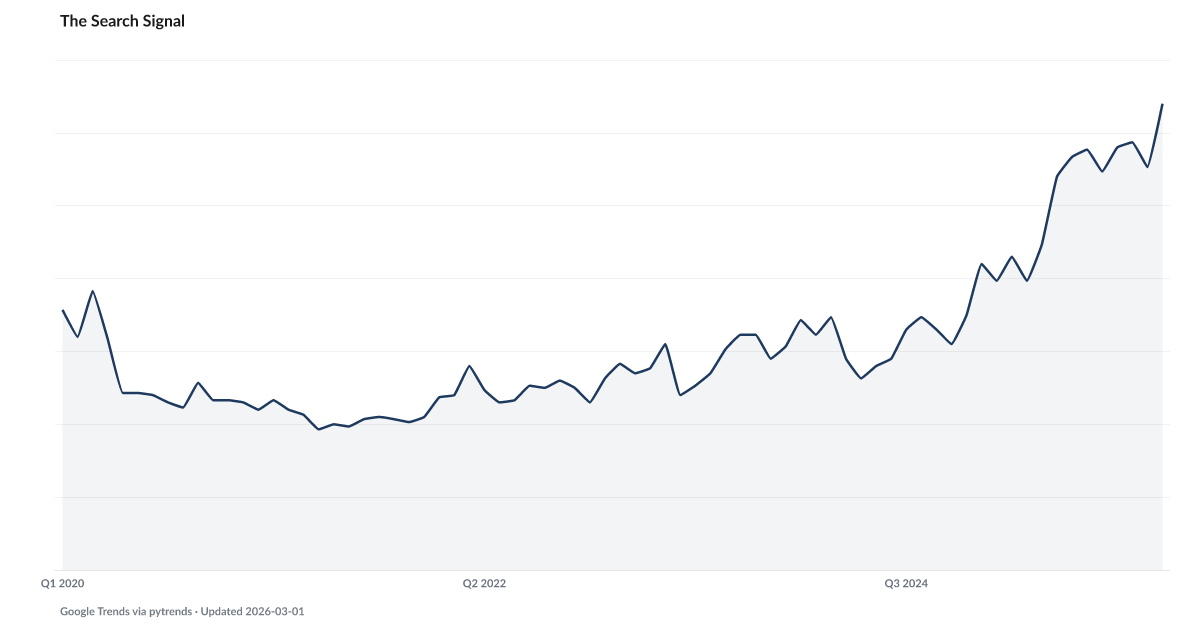
What is the current The Search Signal?
Google Trends data for financial distress keywords — including 'can't pay rent,' 'hardship withdrawal,' 'debt relief,' and 'food stamps near me' — provides a real-time behavioral signal of household financial stress. Unlike surveys and government reports, search data captures what people are actually doing in moments of financial crisis, often weeks or months before those behaviors appear in official statistics. Source: Google Trends.
The composite Google Trends index tracking searches for debt relief, bankruptcy, and 'can't pay rent' hit 64 in February 2026. That is the highest level since tracking began.
People don't search for help when things are fine. They search when a payment is late, a notice has arrived, or the math at the end of the month stopped working. That's what makes search interest in distress terms useful as a real-time signal. It measures private acknowledgment of trouble before that trouble reaches a credit bureau or a courthouse.
The American Default composite tracks a basket of queries. 'Debt relief.' 'Bankruptcy.' 'Can't pay rent.' 'Behind on mortgage.' All measured against a 100-point Google Trends scale. In June 2021 the index bottomed at 19.3, when stimulus checks and forbearance programs were still keeping the crisis suppressed. By February 2026 it had hit 64.0. That is 3.3× the 2021 low. It is a 16 percent jump in a single month.
The indicator leads the hard delinquency data. Households search first, default later. Falling Behind shows total delinquency has been climbing for over a year. The Late Fee confirms credit card delinquency remains elevated. Those are the defaults that already happened. The Search Signal is who's about to join them.
Sixty-four is not a plateau. The index has moved from the low 30s to the low 60s in about fifteen months. That trajectory doesn't look like noise.
Explore Further
How has The Search Signal changed over time?

Most affected counties
Counties with the highest debt burden scores in the County Distress Index.
Explore all 3,144 counties →| Period | Value | YoY Change |
|---|---|---|
| Feb 2026 | 64 | +22.00 |
| Jan 2026 | 55.3 | +20.30 |
| Dec 2025 | 58.7 | +27.70 |
| Nov 2025 | 58 | +25.00 |
| Oct 2025 | 54.7 | +20.00 |
| Sep 2025 | 57.7 | +24.70 |
| Aug 2025 | 56.7 | +27.70 |
| Jul 2025 | 54 | +26.00 |
| Jun 2025 | 44.7 | +18.40 |
| May 2025 | 39.7 | +10.70 |
| Apr 2025 | 43 | +8.30 |
| Mar 2025 | 39.7 | +7.40 |
Frequently Asked Questions
What financial distress keywords does this indicator track?
The indicator tracks search volume for terms like 'can't pay rent,' 'hardship withdrawal,' 'debt relief,' 'bankruptcy near me,' and 'food stamps near me.' Elevated search volume for these terms indicates that more people are actively seeking help with financial problems.
Why use Google search data as a financial indicator?
Search data captures real-time behavior rather than self-reported survey responses. When someone searches 'hardship withdrawal 401k,' they are actively considering or taking that step. This behavioral signal often appears weeks or months before the activity shows up in government statistics.
Where does the Google Trends distress data come from?
Google Trends provides relative search volume data indexed to a baseline period. American Default tracks a composite of financial distress search terms, normalized and indexed to detect acceleration patterns.

Quick poll
Is this affecting you or your household?
Discussion
Get the numbers when they move.
New data drops, indicator updates, and ADI score changes — delivered when it matters. No spam.
or Create an Account for full access
Loading comments…