The Energy Squeeze
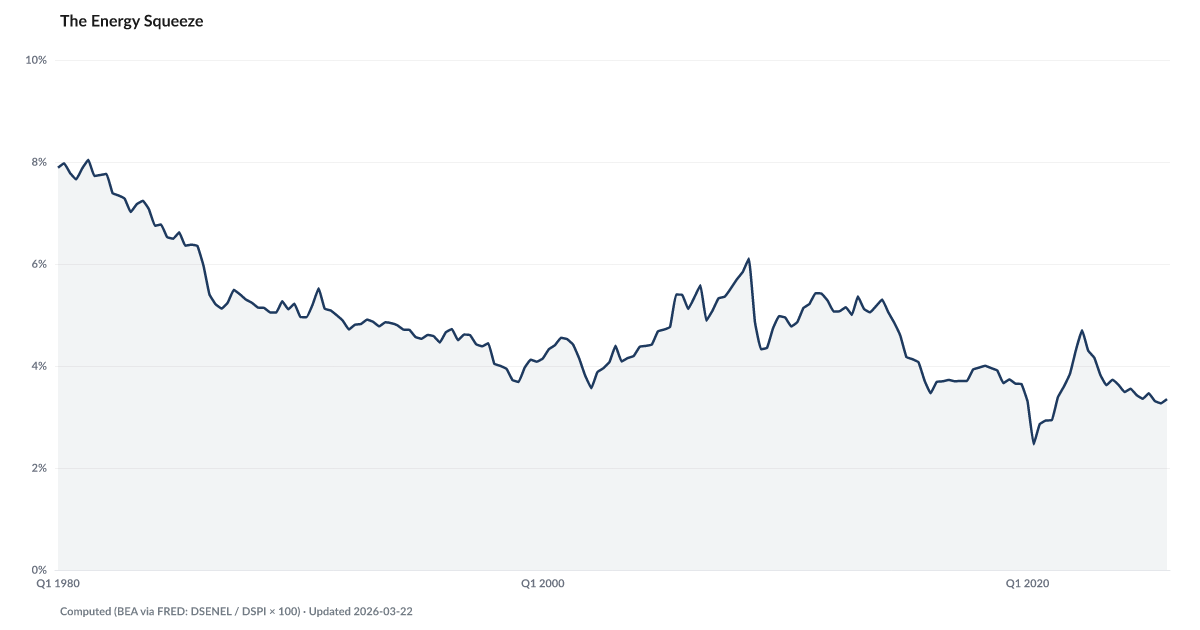
Household energy spending as a share of after-tax income
What is the current The Energy Squeeze?
U.S. household energy expenditures represent 3.35% of spending in the latest reading. The Energy Squeeze tracks household energy costs as a share of overall spending — capturing electricity, natural gas, heating oil, and motor fuel. Low-income households spend 2-3x this share and face energy insecurity: choosing between heating and eating. Source: BLS, EIA.
Household energy costs still absorb 3.4% of disposable income. Off the 2022 shock-era high, but stuck at a plateau that refuses to keep falling.
The 2022 energy shock pushed the household energy burden to 4.7 percent of disposable income, according to BEA data computed from FRED. That erased most of the decade-long decline that followed the shale gas boom, when 2008 through 2013 regularly ran above 5 percent. Every household felt it at the gas pump and in the utility bill at the same time.
The relief came fast. By early 2023, the burden had fallen back under 4 percent. By late 2024 it was at 3.4 percent. Then it stopped moving. The quarterly readings for all of 2025 cluster between 3.27 and 3.47 percent. The decline ended.
Before the pandemic, this number was drifting toward 3 percent on falling natural gas prices and improving efficiency. The glide path broke. The post-shock plateau now sits about fifty basis points above where the pre-pandemic trend was heading, which works out to several hundred dollars a year for a median household that never got it back.
This is the quiet pressure. It doesn't show up in a headline the way The Pump Tax does when gasoline spikes. It shows up at the end of the month, in the check that clears a few days late because the heating bill came in higher than expected.
Explore Further
Is this happening to you?
Have your electric or gas bills changed how you heat or cool your home?
How has The Energy Squeeze changed over time?

Most affected counties
Counties with the highest debt burden scores in the County Distress Index.
Explore all 3,144 counties →| Period | Value | YoY Change |
|---|---|---|
| Q1 2026 | 3.43% | −0.0 pts |
| Q4 2025 | 3.35% | −0.0 pts |
| Q3 2025 | 3.27% | −0.2 pts |
| Q2 2025 | 3.31% | −0.2 pts |
| Q1 2025 | 3.47% | −0.0 pts |
| Q4 2024 | 3.36% | −0.3 pts |
| Q3 2024 | 3.43% | −0.3 pts |
| Q2 2024 | 3.56% | −0.1 pts |
| Q1 2024 | 3.49% | −0.3 pts |
| Q4 2023 | 3.63% | −0.5 pts |
| Q3 2023 | 3.73% | −0.6 pts |
| Q2 2023 | 3.62% | −1.1 pts |
Frequently Asked Questions
What is The Energy Squeeze?
The Energy Squeeze tracks household energy costs as a percentage of total spending, currently 3.35%. It captures utility bills and fuel costs as a share of the household budget.
Why does energy affordability matter?
Energy is essential and non-discretionary. Low-income households are most vulnerable to energy cost spikes, facing impossible trade-offs between heating, food, and debt payments.
Where does this data come from?
Derived from BLS Consumer Expenditure Survey and EIA energy price data.

Quick poll
Is this affecting you or your household?
Discussion
Get the numbers when they move.
New data drops, indicator updates, and ADI score changes — delivered when it matters. No spam.
or Create an Account for full access
Loading comments…