Financial Obligations Ratio
Household financial obligations as share of income
What is the current Financial Obligations Ratio?
The household financial obligations ratio measures total required monthly payments — debt service plus rent, auto leases, homeowner insurance, and property taxes — as a share of disposable income. This broader measure captures financial commitments that the standard debt service ratio misses. Source: Federal Reserve via FRED.
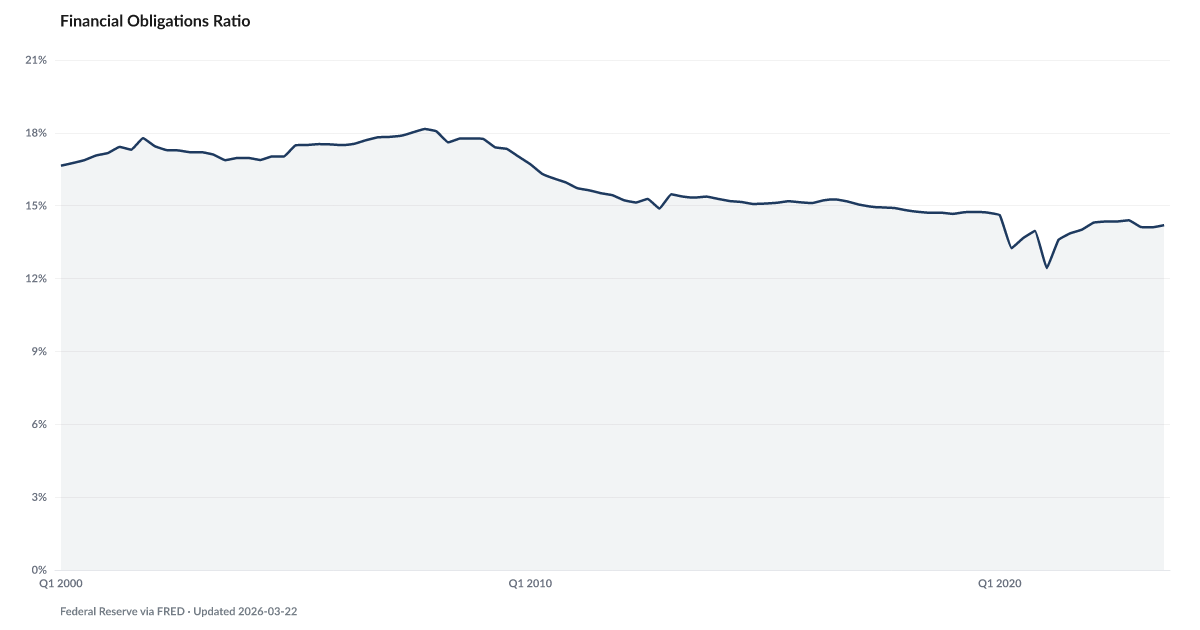
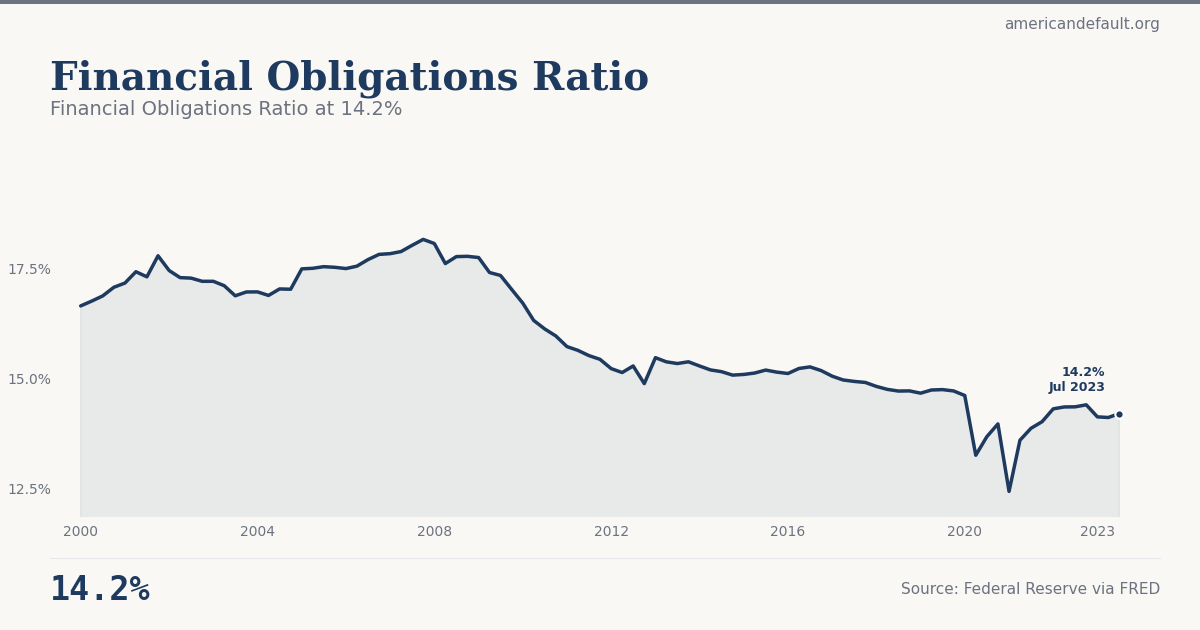
Financial obligations take 14.2 cents of every dollar of disposable income. Below the pre-Great-Recession peak of 18.2%, but climbing since 2021.
The Federal Reserve's Financial Obligations Ratio, FRED series FODSP, measures the share of household disposable income going to financial obligations — debt service plus rent, auto leases, homeowner insurance, and property taxes. It is a broader measure than debt service alone. The Q3 2023 reading is 14.2%.
That is below the 18.2% peak reached in late 2007, at the top of the housing bubble. And it is the usual comfort point cited in macro commentary — obligations are manageable by the historical standard, no cause for alarm.
The comfort point misreads the composition. In 2007 the pressure came from a wave of adjustable-rate mortgages resetting. Mortgage debt service drove the ratio. Today, with most mortgage holders locked into sub-4% rates from 2020-2021, the mortgage component is unusually low. The 14.2% reading is being produced by rising rent, auto insurance, and property taxes, not by the mortgage line.
That is a different kind of pressure. A mortgage reset is a shock that resolves when rates fall. A rent increase is permanent. The Squeeze shows 24% of households spending 95% or more of their income on necessities. Financial obligations at 14.2% sit inside that total. There is no room left for a new shock, even though the ratio itself doesn't look dramatic — and the Buffer Depletion cohort of indicators keeps showing it. Buffer Depletion has historically led Debt Stress by 9 quarters in the American Distress Index.
Explore Further
How has Financial Obligations Ratio changed over time?

Most affected counties
Counties with the highest overall financial distress scores in the County Distress Index.
Explore all 3,144 counties →| Period | Value | YoY Change |
|---|---|---|
| Q3 2023 | 14.2% | −0.2 pts |
| Q2 2023 | 14.11% | −0.2 pts |
| Q1 2023 | 14.12% | −0.2 pts |
| Q4 2022 | 14.4% | +0.4 pts |
| Q3 2022 | 14.35% | +0.5 pts |
| Q2 2022 | 14.35% | +0.8 pts |
| Q1 2022 | 14.31% | +1.9 pts |
| Q4 2021 | 14.01% | +0.1 pts |
| Q3 2021 | 13.86% | +0.2 pts |
| Q2 2021 | 13.59% | +0.3 pts |
| Q1 2021 | 12.43% | −2.2 pts |
| Q4 2020 | 13.96% | −0.7 pts |
Frequently Asked Questions
What is the financial obligations ratio?
The financial obligations ratio measures total required household payments — including debt service, rent, auto leases, homeowner insurance, and property taxes — as a share of disposable personal income. It is a broader measure than the household debt service ratio, which only counts debt payments.
How does this differ from the debt service ratio?
The debt service ratio counts only debt payments (mortgage, credit card, auto loan, student loan). The financial obligations ratio adds rent payments, auto lease payments, homeowner insurance, and property taxes. This gives a more complete picture of fixed monthly costs that households cannot easily reduce.
Where does the financial obligations data come from?
The Federal Reserve publishes the financial obligations ratio quarterly, based on estimates of total required household payments divided by disposable personal income. It is available on FRED alongside the standard debt service ratio.
Quick poll
Is this affecting you or your household?
Discussion
Get the numbers when they move.
New data drops, indicator updates, and ADI score changes — delivered when it matters. No spam.
or Create an Account for full access
Loading comments…