The Tech Drought
87.0k tech sector job openings — tech hiring has not recovered
What is the current The Tech Drought?
Tech sector job openings track the number of available positions in software, IT, and technology — a leading indicator of broader labor market health since tech hiring often contracts before wider economic weakness becomes apparent. Declining tech openings signal reduced demand for the workforce segment most directly affected by both AI displacement and economic slowdowns. Source: BLS JOLTS / Indeed.
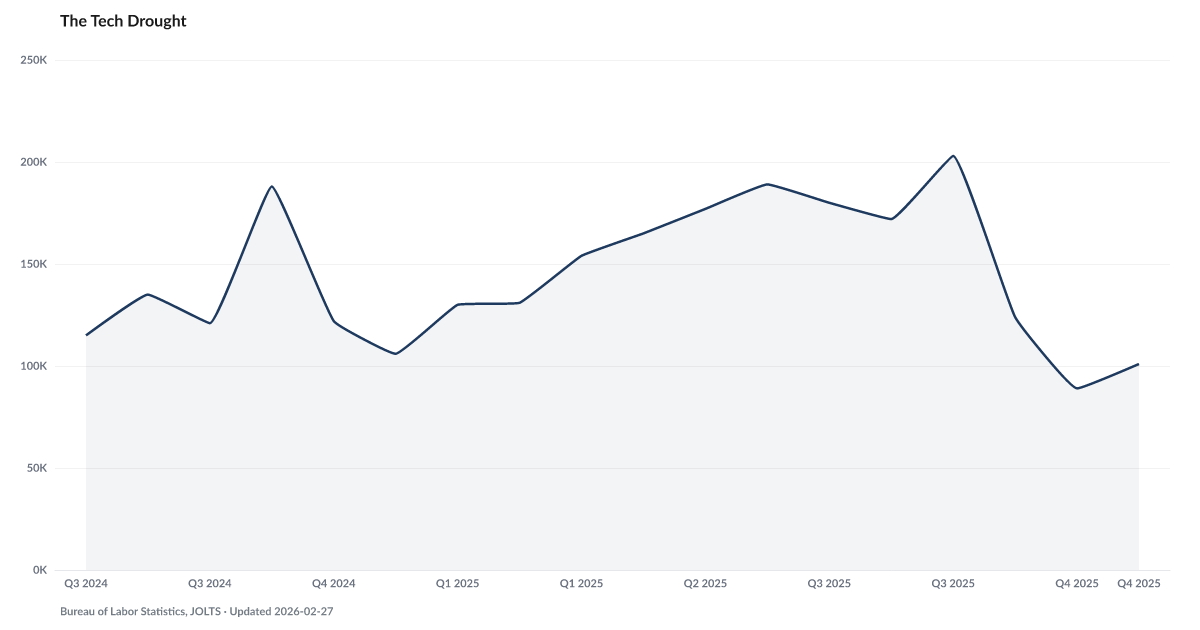
Information-sector job openings fell to 101,000 in April 2026, down 100% below from the 203,000 reading reached three months earlier — a retreat in tech hiring after the sector's 2022 reset.
The BLS Job Openings and Labor Turnover Survey tracks unfilled positions by industry. For the information sector — NAICS 51, which includes software publishing, data processing, and most of what the press calls tech — openings stood at 203,000 in September 2025. By December, that figure was 101,000. The one-quarter drop was severe.
Tech has historically led the broader labor market, both up and down. When tech firms stop hiring, it tends to show up later in the general jobs data. The 2022-2023 tech correction preceded the broader softening in Continued Unemployment Claims and the quiet-quit collapse captured by JOLTS Quits Rate, which has since fallen to the low end of its post-2015 range.
The current pullback carries a wrinkle the 2022 reset didn't. That episode was mostly a correction from pandemic over-hiring. The 2025-2026 pullback is coinciding with a step-change in AI capability — The Horizon has moved from tens of hours to hundreds in twelve months — and with the first measurable wave of AI-attributed layoff announcements in The AI Cut. How much of the tech drought is cyclical and how much is structural is the open question.
For households whose income depends on tech-sector work, the distinction matters. Cyclical downturns reverse; structural ones don't. The downstream indicator to watch is Youth Unemployment, where early-career workers — the group most exposed to entry-level automation — are already running well above the rate of workers over 35.
Explore Further
Is this happening to you?
Have you noticed tech job postings drying up in your area?
How has The Tech Drought changed over time?

Most affected counties
Counties with the highest labor scores in the County Distress Index.
Explore all 3,144 counties →| Period | Value | YoY Change |
|---|---|---|
| Apr 2026 | 87K | −47K |
| Mar 2026 | 83K | −32K |
| Feb 2026 | 80K | −45K |
| Jan 2026 | 100K | −1K |
| Dec 2025 | 112K | +7K |
| Nov 2025 | 88K | −31K |
| Oct 2025 | 117K | −61K |
| Sep 2025 | 119K | +5K |
| Aug 2025 | 141K | +36K |
| Jul 2025 | 157K | +52K |
| Jun 2025 | 123K | +15K |
| May 2025 | 109K | −11K |
Frequently Asked Questions
Why are tech job openings a leading indicator?
Technology companies often cut hiring plans before the broader economy weakens. Declining tech openings can precede wider employment contractions by several months, making them an early warning signal for labor market deterioration.
How do AI and tech layoffs interact?
AI is simultaneously creating new tech roles (AI engineering, prompt engineering, ML ops) and eliminating existing ones (QA, junior development, content writing, data entry). The net effect on tech employment depends on whether new role creation outpaces displacement.
Where does tech job opening data come from?
American Default tracks tech openings from BLS JOLTS (Job Openings and Labor Turnover Survey) and Indeed's job posting index, which provides near-real-time data on employer hiring intent.

Quick poll
Is this affecting you or your household?
Discussion
Get the numbers when they move.
New data drops, indicator updates, and ADI score changes — delivered when it matters. No spam.
or Create an Account for full access
Loading comments…