Continued Unemployment Claims (SA)
Ongoing unemployment insurance claims
Historically follows Initial Unemployment Claims (SA) by 1 quarter — no active signal. Initial Unemployment Claims (SA) · View projections
What is the current Continued Unemployment Claims (SA)?
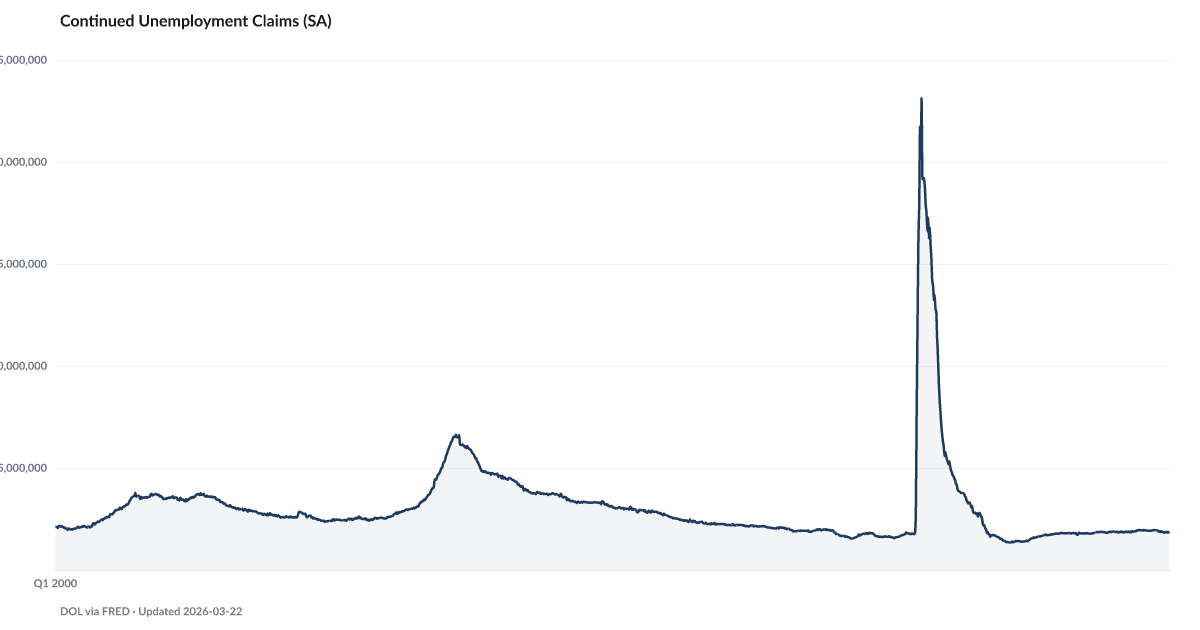
Continuing unemployment claims (insured unemployment) stood at 1.85 million as of the latest weekly report, according to the Department of Labor. Unlike initial claims which measure new job losses, continuing claims show how many people remain unemployed and collecting benefits — a signal of how long displaced workers stay jobless. Source: Department of Labor via FRED (CCSA).
Roughly 1,810,000 Americans are collecting ongoing unemployment benefits — a level that has held above the pre-pandemic baseline for two straight years.
Continuing claims measure how many people are receiving unemployment insurance in any given week after their initial filing. The most recent DOL reading puts the figure at 1,810,000, seasonally adjusted. That is above the 2022 low of 1,344,000 but below the 2020 shock reading of 23.1 million. The trajectory is the concern, not the level.
Continuing claims are downstream of Initial Unemployment Claims by 1 quarter with r = 0.95. When first-time filings rise, ongoing claims rise later. Right now initial claims are low, but continuing claims are creeping up anyway — which means workers who do file are staying jobless longer, even if the inflow is modest.
That pattern lines up with the demand-side tells. Indeed Job Postings Index has flatlined at pre-pandemic levels. JOLTS Quits Rate at the low end of its post-2015 range. Layoffs aren't surging. Hiring isn't recovering. In that environment, the people who lose jobs stay on unemployment longer, and continuing claims grind upward.
For households, the duration matters more than the headline. Thirteen weeks of unemployment insurance at roughly fifty percent of previous wages is manageable for most families. Twenty-six weeks is where The Buffer runs out, hardship withdrawals begin, and the chain into Falling Behind gets shorter.
Explore Further
How has Continued Unemployment Claims (SA) changed over time?

Most affected counties
Counties with the highest labor scores in the County Distress Index.
Explore all 3,144 counties →| Period | Value | YoY Change |
|---|---|---|
| Jun 2026 | 1,810,000 | −125000.00 |
| May 2026 | 1,786,000 | −161000.00 |
| May 2026 | 1,771,000 | −125000.00 |
| May 2026 | 1,785,000 | −132000.00 |
| May 2026 | 1,771,000 | −118000.00 |
| May 2026 | 1,776,000 | −108000.00 |
| Apr 2026 | 1,758,000 | −118000.00 |
| Apr 2026 | 1,776,000 | −130000.00 |
| Apr 2026 | 1,808,000 | −32000.00 |
| Apr 2026 | 1,809,000 | −67000.00 |
| Mar 2026 | 1,787,000 | −65000.00 |
| Mar 2026 | 1,832,000 | −57000.00 |
Frequently Asked Questions
What are continuing unemployment claims?
Continuing claims count the number of people who remain on unemployment insurance after their initial claim. At 1.85 million, it shows the stock of insured unemployed workers.
How do continuing claims differ from initial claims?
Initial claims measure new job losses each week. Continuing claims show how many people remain unemployed — a rising number means workers are having difficulty finding new jobs.
Where does this data come from?
Published weekly by the Department of Labor, available via FRED series CCSA (seasonally adjusted).

Quick poll
Is this affecting you or your household?
Discussion
Get the numbers when they move.
New data drops, indicator updates, and ADI score changes — delivered when it matters. No spam.
or Create an Account for full access
Loading comments…