Initial Unemployment Claims (SA)
Weekly new filings for unemployment insurance
Validated leading indicator for Continued Unemployment Claims (SA) (1q lag) — currently dormant. Continued Unemployment Claims (SA) · View projections
What is the current Initial Unemployment Claims (SA)?
Initial unemployment claims registered 226,000 for the week ending June 2026, according to the Department of Labor (FRED series ICSA, seasonally adjusted). This weekly filing count is the highest-frequency labor market indicator available and feeds the ADI's Labor domain. Source: U.S. Department of Labor via FRED.
Weekly first-time unemployment filings remain near historic lows at roughly 226,000 — but the same series has historically led the unemployment rate by 1 quarter with r = 0.79.
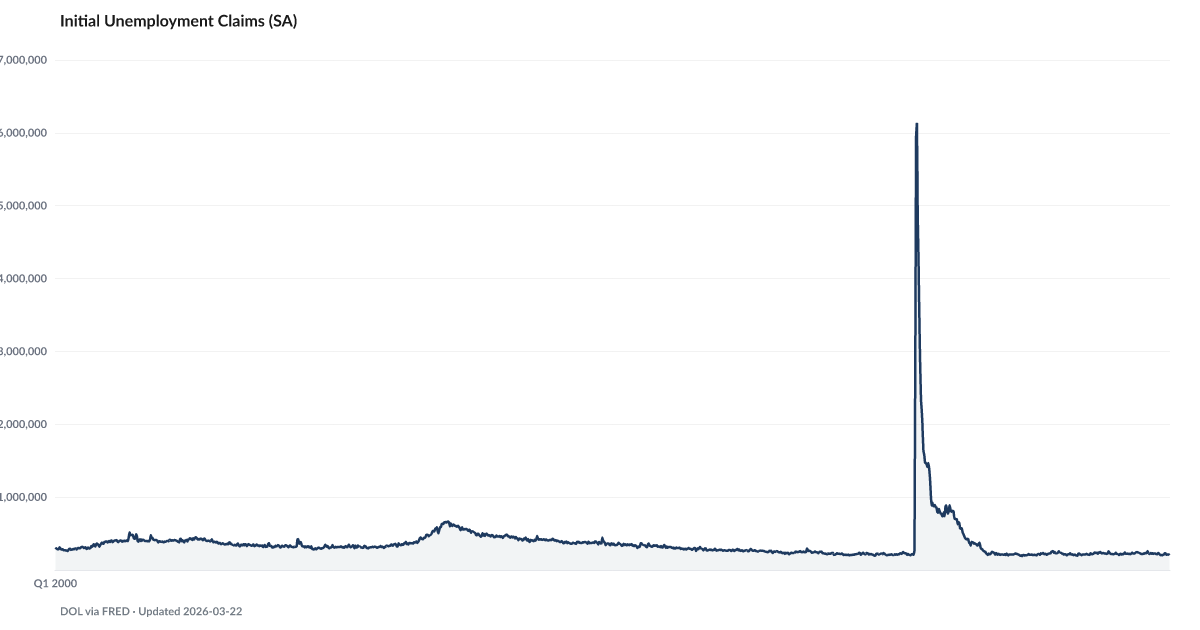
The Department of Labor publishes initial unemployment claims every Thursday morning. The most recent reading, 226,000 seasonally adjusted, is roughly where the series has sat for three years. For context, claims averaged under 230,000 through the 2018-2019 expansion, hit 6.1 million in the March 2020 shutdown, and eased back toward pre-pandemic norms by late 2021.
The low headline number is genuinely reassuring, with one caveat. Initial claims are the most-watched labor indicator precisely because they lead the rest. American Default's own leading-indicator research puts the relationship between initial claims and Continued Unemployment Claims at 1 quarter with r = 0.95, and between initial claims and the Unemployment Rate at 1 quarter with r = 0.79. Where initial claims go, the rest of the labor market follows.
What makes the current reading hard to read is the composition of layoffs around it. Pink Slips — Challenger's announced-layoffs series — has been running at post-GFC highs, driven by federal workforce cuts and AI-attributed restructuring. Announced layoffs and filed claims are normally tightly linked. Right now they aren't. One explanation is severance: many of the 2025-2026 announced cuts came with generous packages that delay the UI filing by weeks or months. Another is that announcement-to-effective dates have stretched.
The signal to watch is the turn, not the level. Initial claims moved through 250,000 ahead of every prior recession since 1967. The reading today is nowhere near that threshold. If it starts drifting, the lag chain means U-6 Underemployment and the headline unemployment rate are already spoken for.
Explore Further
How has Initial Unemployment Claims (SA) changed over time?

Most affected counties
Counties with the highest labor scores in the County Distress Index.
Explore all 3,144 counties →| Period | Value | YoY Change |
|---|---|---|
| Jun 2026 | 226,000 | −17000.00 |
| Jun 2026 | 230,000 | −16000.00 |
| May 2026 | 225,000 | −19000.00 |
| May 2026 | 212,000 | −24000.00 |
| May 2026 | 210,000 | −15000.00 |
| May 2026 | 212,000 | −14000.00 |
| May 2026 | 199,000 | −29000.00 |
| Apr 2026 | 190,000 | −49000.00 |
| Apr 2026 | 215,000 | −9000.00 |
| Apr 2026 | 208,000 | −9000.00 |
| Apr 2026 | 218,000 | −5000.00 |
| Mar 2026 | 203,000 | −17000.00 |
Frequently Asked Questions
What are initial unemployment claims?
Initial unemployment claims (FRED series ICSA) count the number of workers filing for unemployment insurance benefits for the first time each week. The most recent reading is 226,000 (June 2026). It is the highest-frequency labor market indicator available.
What level of initial claims signals trouble?
Claims below 250,000 per week are generally considered healthy. Between 250,000 and 300,000 indicates softening. Above 300,000 signals material labor market deterioration. During the 2008 crisis, claims peaked above 600,000 per week.
How do initial claims connect to the American Distress Index?
Initial claims are one of the two indicators in the ADI's Labor domain, alongside the unemployment rate. The ADI's five domains are equally weighted, so Labor carries one-fifth of the composite. Because claims are reported weekly with minimal revision lag, they provide the ADI with a near-real-time labor signal.

Quick poll
Is this affecting you or your household?
Discussion
Get the numbers when they move.
New data drops, indicator updates, and ADI score changes — delivered when it matters. No spam.
or Create an Account for full access
Loading comments…