In Mingo County, West Virginia, benefit checks have brought in more money than paychecks since 2015
In 2024, 46 cents of every dollar of income here came from a benefit check: Social Security, Medicare, Medicaid, veterans' benefits and the like (46.1%, Bureau of Economic Analysis). Across the country it was 18 cents.
More distressed than 96% of U.S. counties.
What drives Mingo County's score
In Mingo County, jobs weigh most: the score for jobs is 98.7. About half of adults aged 25 to 54 (50.3%, 2020 to 2024) aren't working, a higher share than in 99% of U.S. counties. Late payments on loans come next, at 91.3.
The County Distress Index combines five things we measure for every county: jobs, late payments on loans, income and the safety net, collections and bankruptcy, and housing costs. Each gets a score from 0 to 100; the higher the score, the worse off the county is compared with others.
Mingo County does better than most counties on two measures: renters paying half their income or more in rent (16.1%, 2020 to 2024) and people without health insurance (6.8%, 2020 to 2024).
The five parts count equally; together they hold 14 measures. Under each part, a bar shows where Mingo County ranks among all 3,144 U.S. counties on that measure, as a percentile: the share of counties it is higher than. A longer bar means more trouble.
- 98.7 of 100
Jobs
Biggest factorAdults not working, 2020–24 Census survey; unemployment through Aug 2026
- Adults 25 to 54 not working50.3% · 2020 to 202499th percentile
- Unemployment rate, 12-month average7.3% · Sep 2025 to Aug 202697th percentile
-
- 91.3 of 100
Late payments
Credit records, August 2025; credit scores, Q4 2025
- People with a car or retail loan behind13.1% · August 202597th percentile
- People with a credit card behind8.7% · August 202589th percentile
- People with a subprime credit score34.6% · Q4 202586th percentile
-
- 86.0 of 100
Income and safety net
Poverty and income, 2024; disability and insurance, 2020–24 Census survey
- Children below the poverty line33.7% · 202495th percentile
- People with a disability31.9% · 2020 to 202499th percentile
- Median household income (lower income, longer bar)$43,289 · 202498th percentile
- People below the poverty line25.7% · 202496th percentile
- People without health insurance6.8% · 2020 to 202440th percentile
-
- 69.2 of 100
Collections and bankruptcy
Credit records, August 2025; bankruptcy filings, 2025
- People with unpaid debt sent to a collector38.7% · August 202592nd percentile
- Bankruptcy filings per 100,000 people118.1 · 202545th percentile
-
- 63.8 of 100
Housing costs
HUD's fair market rents, fiscal year 2027; renters, 2020–24 Census survey
- Rent on a two-bedroom as a share of the median income26.6% · fiscal year 202789th percentile
- Renters paying half their income or more in rent16.1% · 2020 to 202437th percentile
-
Sources: U.S. Department of Housing and Urban Development Fair Market Rents and U.S. Census Bureau income; Census Bureau, American Community Survey; Urban Institute, Debt in America; Administrative Office of the U.S. Courts, Table F-5A; Equifax via the St. Louis Fed; U.S. Bureau of Labor Statistics, Local Area Unemployment Statistics; Census Bureau, Small Area Income and Poverty Estimates. County Distress Index by American Default Research, from data through Aug 2026.
Where the money in Mingo County comes from
The Bureau of Economic Analysis adds up all the income that reaches the people of a county and splits it three ways: pay from work, income from investments and rent, and benefit checks.
Cents of every dollar of income, 2024
Mingo County
West Virginia
United States
- Pay from work
- Investments and rent
- Benefit checks
In Mingo County in 2024, pay from work was 43 cents of every dollar of income. Income from investments and rentals was 11 cents. Benefit checks were 46 cents. Across the country, pay is 61 cents of the dollar and benefit checks are 18.
In 1969, pay was 71 cents of every dollar here and benefit checks were 22 cents.
In Mingo County, benefit checks have brought in more than pay since 2015
Benefit checks and pay from work as shares of all personal income, Mingo County, West Virginia: 46.1% and 42.6% in 2024. Yearly, 1969–2024.
Use this chart Free to use with credit
The quote: In 2024, benefit checks made up 46.1% of all personal income in Mingo County, West Virginia (U.S. Bureau of Economic Analysis, CAINC4).
Benefit checks are Social Security, Medicare and Medicaid paid on people's behalf, veterans' benefits, and food and income support, so a high share usually means an older population, low pay, or both. In Mingo County, 21.9% of residents are 65 or older (Census Bureau, 2024), against 17.2% nationally.
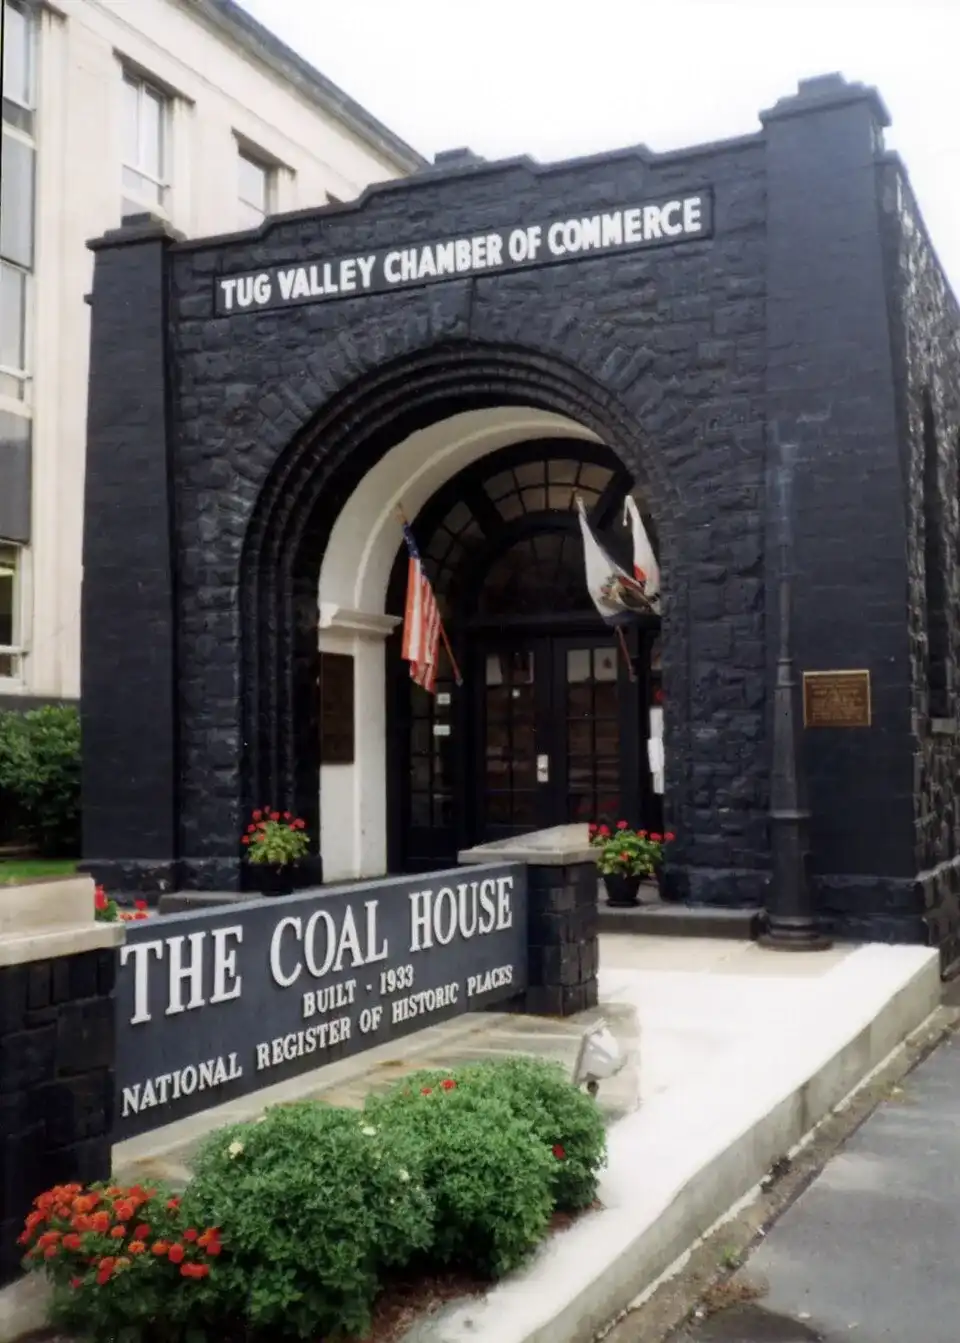
The Coal House in Williamson, the county seat, was built in 1933 from 65 tons of coal, the idea of the Norfolk & Western Railway's superintendent of fuel mines. In 2024, benefit checks brought in 46 cents of every dollar here.
Photo: Badagnani at en.wikipedia via Wikimedia Commons, CC BY-SA 3.0 · Fact: e-WV: The West Virginia Encyclopedia, "Williamson Coal House"

How Mingo County has changed
The number of people living in Mingo County fell by about three in 10 between 1969 and 2024, from 33,275 to 21,712. The number of jobs located there fell by about half from 1990 to 2024.
Unemployment fell from 11.1% in 1990 to 6.5% in 2025.
| Measure | Then | Now |
|---|---|---|
| People living in the countyBEA | 1969 33,275 | 2024 21,712 |
| Jobs located in the countyBLS QCEW | 1990 9,203 | 2024 4,951 |
| Unemployment rateBLS LAUS | 1990 11.1% | 2025 6.5% |
| People below the poverty lineCensus SAIPE | 1989 26.3% | 2024 25.7% |
| Median household income (not adjusted for prices)Census SAIPE | 1989 $19,775 | 2024 $43,289 |
| Share of income from benefit checksBEA | 1969 21.8% | 2024 46.1% |
Figures are as each agency published them, not adjusted for prices. We don't chart the distress score over time because it compares counties at one moment.
Dated events in Mingo County's history
Largest decennial census count
The county's largest recorded population was the 1950 Census count of 47,409. The 2020 Census counted 23,568, 50% of the peak. Census Bureau
1895
Formed 1895 from parts of Logan County. Wikipedia
1977
Major floods along the Tug Fork River in 1977 and again in 1984. Wikipedia
1999
Wildfire: one death. NOAA Storm Events Database
2004
Flash flood: $9 million in property damage. NOAA Storm Events Database
2009
Flood: $24 million in property damage. NOAA Storm Events Database
2025
Flood: $5 million in property damage. NOAA Storm Events Database
-
Since 1967
35 federal disaster and emergency declarations have covered Mingo County, 25 of them for flooding. FEMA
Storms are listed if they did $1 million or more in damage or killed someone.

The railroad tunnel at Glen Alum, a town named for the Glen Alum Coal Company, on a branch of the Norfolk and Western Railway.
Photo: FatCat96 via Wikimedia Commons, CC BY-SA 4.0 · Fact: Wikipedia, "Glen Alum, West Virginia"

Mingo County beside its neighbors
Mingo County scores higher than all eight counties that border it, in West Virginia, Kentucky and Virginia. For the share of income from benefit checks, Mingo County ranks 3rd of the nine; Martin County is highest, at 60.9%.
| County | Score | Poverty | Benefit checks |
|---|---|---|---|
| Mingo County, WV | 96 | 25.7% | 46.1% |
| Martin County, KY | 95 | 33.8% | 60.9% |
| Pike County, KY | 95 | 22.4% | 44.9% |
| Buchanan County, VA | 95 | 23.5% | 44.5% |
| McDowell County, WV | 94 | 38.4% | 52.2% |
| Wyoming County, WV | 93 | 24.8% | 42.0% |
| Logan County, WV | 90 | 21.1% | 42.4% |
| Lincoln County, WV | 88 | 21.4% | 36.9% |
| Wayne County, WV | 74 | 14.9% | 30.9% |
Distress score: American Default Research, County Distress Index, data through Aug 2026; each county scored against all 3,144. Poverty rate: Census Bureau, Small Area Income and Poverty Estimates, 2024. Benefit checks: Bureau of Economic Analysis, 2024. Neighbors share a border, from Census county maps.
Is Mingo County the poorest county in West Virginia?
No, Mingo County's poverty rate was 25.7% in 2024, 3rd highest of 55 in West Virginia (U.S. Census Bureau, Small Area Income and Poverty Estimates). By that measure the poorest county in the state is McDowell County, at 38.4%. On our distress index, which counts more than poverty, Mingo County ranks 2nd of 55 in the state.
Mingo County, West Virginia: common questions
What is the poverty rate in Mingo County, West Virginia?
25.7% in 2024, according to the U.S. Census Bureau, Small Area Income and Poverty Estimates: about one in four people. Among children it was 33.7%.
Is Mingo County the poorest county in West Virginia?
No, Mingo County's poverty rate was 25.7% in 2024, 3rd highest of 55 in West Virginia (U.S. Census Bureau, Small Area Income and Poverty Estimates). By that measure the poorest county in the state is McDowell County, at 38.4%. On our distress index, which counts more than poverty, Mingo County ranks 2nd of 55 in the state.
What is the population of Mingo County, West Virginia?
About 21,712 people in 2024, by the Bureau of Economic Analysis's count. The 2020 Census counted 23,568, half the county's peak of 47,409 in 1950.
How is the County Distress Index calculated?
We rank every U.S. county on 14 federal measures of money trouble, grouped into five equally weighted parts, and average them. The published score is the share of the other 3,143 counties with a lower average. The methodology lists every measure and its source.
If you're behind on your mortgage in Mingo County
A U.S. Department of Housing and Urban Development-approved housing counselor works at a nonprofit agency approved by the U.S. Department of Housing and Urban Development. The counseling to avoid foreclosure is free, and a counselor can help you talk to your mortgage company and understand what it offers, according to the Consumer Financial Protection BureauSourceCFPB.
-
Housing Authority of Mingo County
HUD-approved housing counselor
-
Legal Aid of West Virginia
Legal aid
-
Mountain State Justice, Inc.
Legal aid
-
HUD-approved housing counselors
Counseling to avoid foreclosure is free. Our help directory lists 1,311 approved agencies by state.
The score, its 14 measures and their sources, in one file. Free to use with credit to American Default Research.
Sources and method
- American Default Research · County Distress Index Data through Aug 2026, built from HUD Fair Market Rents and Census income; Census Bureau, American Community Survey; Urban Institute, Debt in America; U.S. Courts, Table F-5A; Equifax via the St. Louis Fed; Bureau of Labor Statistics, Local Area Unemployment Statistics; Census Bureau, Small Area Income and Poverty Estimates. Our methodology
- U.S. Bureau of Economic Analysis, Regional Economic Accounts (CAINC4) · income shares Where the money in Mingo County comes from, 2024.
- History The agencies named in each row and the linked records above.