Atlanta Fed Wage Growth Tracker (1st Quartile)
Annual wage growth for the lowest-paid quartile of U.S. workers
What is the current Atlanta Fed Wage Growth Tracker (1st Quartile)?
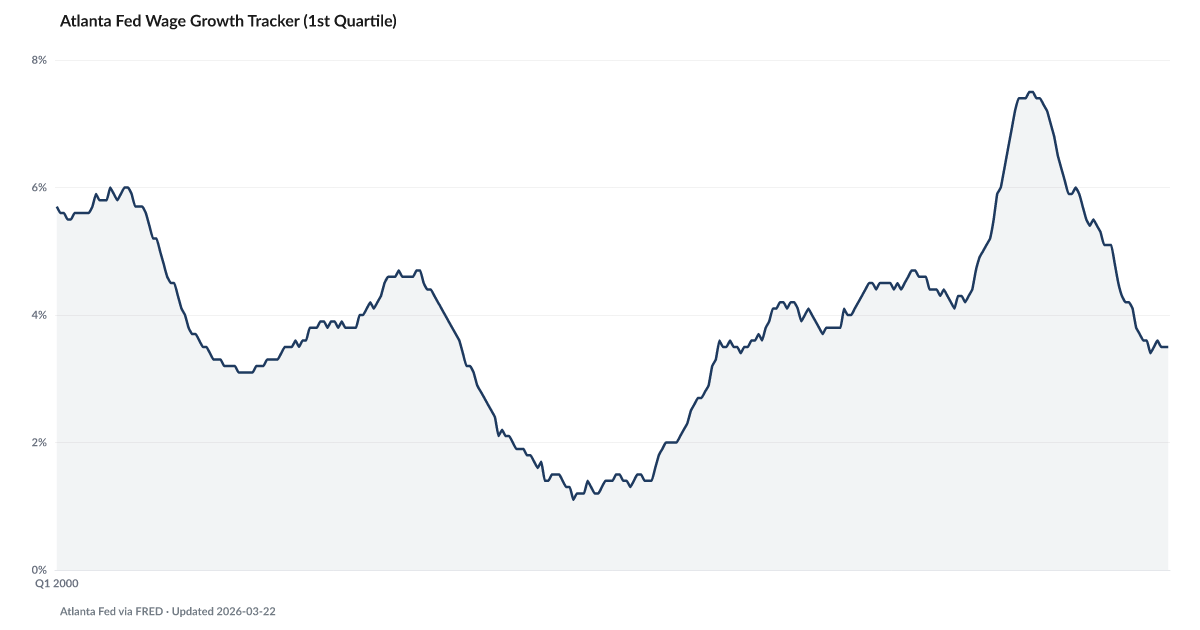
Wage growth for workers in the bottom quartile of the earnings distribution was 3.5% year-over-year in the latest reading, according to the Atlanta Fed Wage Growth Tracker. This measure specifically tracks pay growth for the lowest-paid workers — the population most vulnerable to financial distress. Source: Federal Reserve Bank of Atlanta via FRED.
Wage growth for the bottom-paid quartile of U.S. workers has fallen from 7.4% in 2022 to 3.5% now — roughly half the 2022 reading, while the cost of necessities has not moved the same way.
The Atlanta Fed Wage Growth Tracker measures the median year-over-year pay increase for a matched sample of U.S. workers — the same worker in two consecutive years, not two different workers compared at a point in time. For the bottom quartile of earners, that figure is now 3.5%, roughly half the reference reading from October 2022. Bottom-quartile wage growth has lost much of its momentum in three years.
At 3.5%, the bottom-quartile worker's raise is roughly in line with current consumer inflation — which means the real raise, after inflation, is close to zero. For households in this quartile, that matters more than it does higher up the income distribution, because bottom-quartile earners spend a larger share of income on necessities whose prices have risen faster than the headline CPI — groceries, rent, auto insurance, health care.
The slowdown coincides with the plunge in JOLTS Quits Rate to the low end of its post-2015 range. The 2021-2022 wage surge for low earners was driven by workers switching jobs for raises. When workers stop quitting, the wage pressure that a tight labor market produces disappears, and employer pricing power over wages returns.
American Default tracks this series because low-wage workers are the most exposed to the downstream distress chain. The Buffer shows personal savings near historic lows. Falling Behind shows rising delinquency on consumer credit. Wage growth that fails to outpace the cost of essentials is where that chain begins.
Explore Further
Is this happening to you?
Are the lowest-wage workers you know falling further behind?
How has Atlanta Fed Wage Growth Tracker (1st Quartile) changed over time?
Most affected counties
Counties with the highest labor scores in the County Distress Index.
Explore all 3,144 counties →| Period | Value | YoY Change |
|---|---|---|
| May 2026 | 3.5% | −0.2 pts |
| Apr 2026 | 3.6% | −0.2 pts |
| Mar 2026 | 3.5% | −0.6 pts |
| Feb 2026 | 3.5% | −0.7 pts |
| Jan 2026 | 3.5% | −0.7 pts |
| Dec 2025 | 3.5% | −0.8 pts |
| Nov 2025 | 3.6% | −0.9 pts |
| Sep 2025 | 3.5% | −1.6 pts |
| Aug 2025 | 3.4% | −1.7 pts |
| Jul 2025 | 3.6% | −1.5 pts |
| Jun 2025 | 3.6% | −1.7 pts |
| May 2025 | 3.7% | −1.7 pts |
Frequently Asked Questions
What is the Atlanta Fed Wage Growth Tracker?
The Atlanta Fed Wage Growth Tracker measures the median percent change in hourly wages for the same individuals over 12 months. The 1st quartile version tracks wage growth specifically for the lowest-paid workers.
Why track low-wage worker pay growth?
Low-wage workers are most vulnerable to cost-of-living increases. When their wage growth falls below inflation, financial distress intensifies. The American Distress Index monitors this gap.
Where does this data come from?
Published monthly by the Federal Reserve Bank of Atlanta, based on matched CPS microdata, available via FRED.

Quick poll
Is this affecting you or your household?
Discussion
Get the numbers when they move.
New data drops, indicator updates, and ADI score changes — delivered when it matters. No spam.
or Create an Account for full access
Loading comments…