JOLTS Quits Rate
Share of workers voluntarily leaving their jobs
What is the current JOLTS Quits Rate?
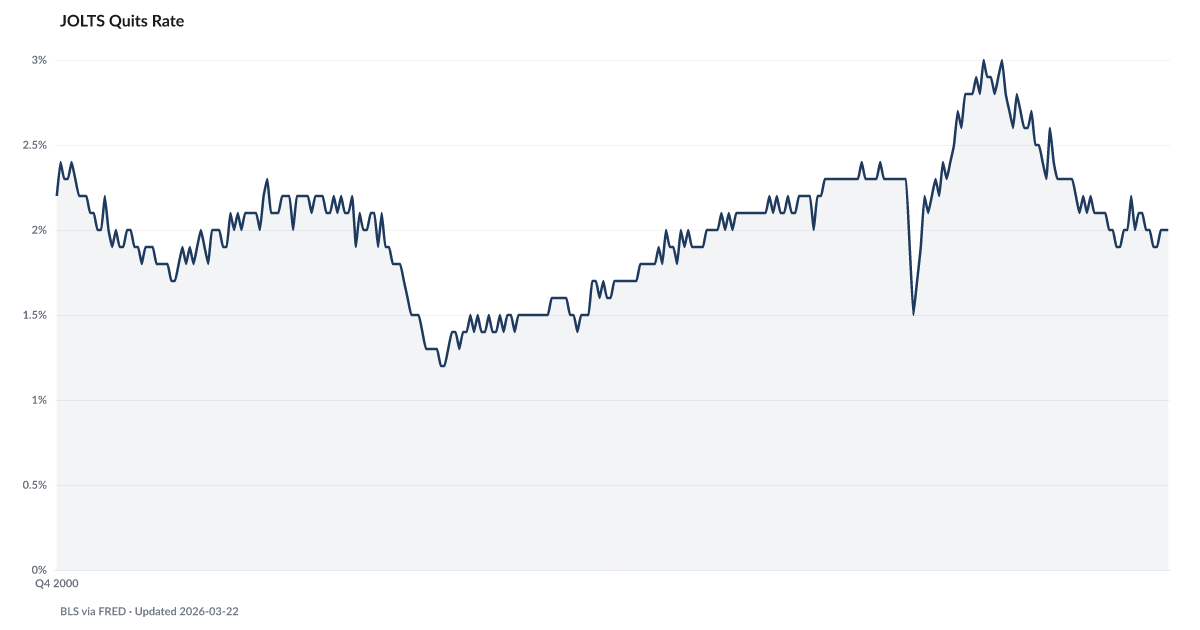
The JOLTS quits rate was 2.0% in the latest reading, according to the Bureau of Labor Statistics. The quits rate measures the share of workers voluntarily leaving their jobs — a signal of worker confidence. When workers stop quitting, it signals they see fewer opportunities, a precursor to broader labor market weakening. Source: BLS JOLTS via FRED (JTSQUR).
The rate at which U.S. workers voluntarily quit their jobs has settled at 1.9% — well below the 3.0% Great Resignation reading in late 2021, and a cleaner signal of confidence in the labor market than the unemployment rate itself.
The BLS Job Openings and Labor Turnover Survey reports that 1.9% of U.S. workers voluntarily quit their jobs in April 2026. That sits in the same range as the early-2015 lows, excluding the brief 2020 COVID collapse when the rate fell to 1.5%. At the Great Resignation high in November 2021, 3.0% of workers were quitting monthly. The quits rate has since fallen by more than a third.
Quitting is discretionary. Workers quit when they are confident they can land something better. They stop quitting when they aren't. That makes the quits rate one of the cleanest real-time reads of labor-market tightness from the worker's side — and a leading indicator of wage pressure. The 2021-2022 wage surge was driven by workers switching jobs. The 2025-2026 wage slowdown, captured in the Atlanta Fed Wage Growth Tracker, is its reverse.
The 1.9% reading lines up with the demand-side signal in Indeed Job Postings Index, which has flatlined at pre-pandemic levels. Workers can feel what the hiring data shows. Fewer openings means fewer outside offers. Fewer outside offers means fewer raises from a move. A stalled hiring market and a collapsing quits rate are the same story told twice.
The household consequence runs through the wage channel. When quits freeze, employer pricing power over wages returns. Real wages for the bottom quartile have come down sharply from their 2022 high, leaving bottom-paid workers barely above inflation. That slowdown feeds directly into The Buffer and then into Falling Behind, where delinquency has already turned up.
Explore Further
How has JOLTS Quits Rate changed over time?

Most affected counties
Counties with the highest labor scores in the County Distress Index.
Explore all 3,144 counties →| Period | Value | YoY Change |
|---|---|---|
| Apr 2026 | 1.9% | −0.1 pts |
| Mar 2026 | 2% | −0.2 pts |
| Feb 2026 | 1.9% | −0.1 pts |
| Jan 2026 | 2% | +0.0 pts |
| Dec 2025 | 2% | +0.1 pts |
| Nov 2025 | 2% | +0.1 pts |
| Oct 2025 | 1.9% | −0.1 pts |
| Sep 2025 | 1.9% | −0.1 pts |
| Aug 2025 | 2% | −0.1 pts |
| Jul 2025 | 2% | −0.1 pts |
| Jun 2025 | 2.1% | +0.0 pts |
| May 2025 | 2.1% | +0.0 pts |
Frequently Asked Questions
What is the JOLTS quits rate?
The JOLTS quits rate measures the percentage of employed workers who voluntarily leave their jobs each month. At 2.0%, it reflects worker confidence in finding new employment.
Why does the quits rate matter for financial distress?
A falling quits rate signals workers feel trapped — they see fewer job opportunities and are afraid to leave. This precedes wage stagnation and rising unemployment, which the American Distress Index tracks.
Where does this data come from?
Published monthly by the Bureau of Labor Statistics as part of the Job Openings and Labor Turnover Survey (JOLTS), available via FRED series JTSQUR.

Quick poll
Is this affecting you or your household?
Discussion
Get the numbers when they move.
New data drops, indicator updates, and ADI score changes — delivered when it matters. No spam.
or Create an Account for full access
Loading comments…