Youth Unemployment Rate (16-24)
Unemployment rate for workers ages 16 to 24
What is the current Youth Unemployment Rate (16-24)?
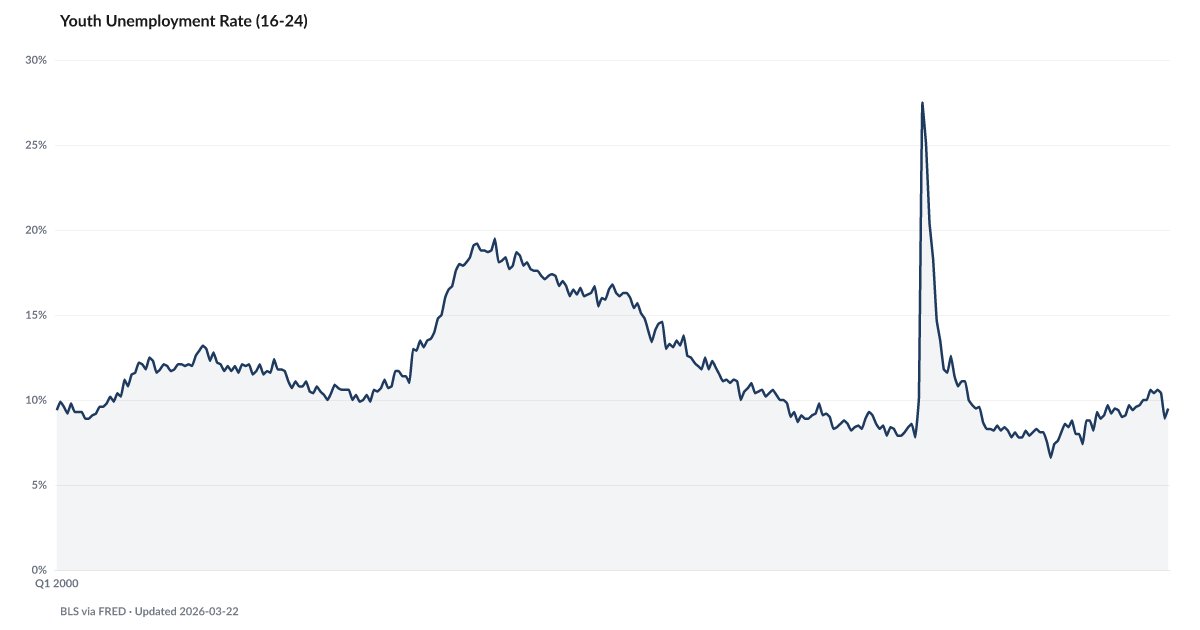
Youth Unemployment Rate (16-24): 9.4% as of 2026-05, and worsening. Source: BLS via FRED.
Young workers — the age group most exposed to entry-level automation — are seeing unemployment drift higher than the headline rate, even as overall labor markets stay near full employment.
The BLS reports unemployment for workers ages 16-24 at 9.4% in May 2026. Young workers cycle through first jobs more often, so a gap above the headline Unemployment Rate is normal — but the shape of this cycle is different from the last one. In 2022, youth unemployment averaged just above 8%. In 2023 it briefly dipped below 7%. The run from 2024 through mid-2025 climbed steadily higher and peaked above 10% before easing.
Entry-level positions are where most younger workers enter the labor force, and entry-level positions are disproportionately the ones AI can now do unsupervised. The Horizon shows AI task-completion capability now reaching hundreds of hours of autonomous work. The Adoption Curve shows that capability reaching a growing share of employer businesses. The jobs being absorbed first are not the senior ones.
A softening youth labor market is also a household distress signal even when the younger worker still lives at home. Parents absorbing an unemployed 22-year-old are running their buffers down just as fast as if the distress were their own. The Buffer shows the personal savings rate near historic lows, which means there is less cushion in the household to absorb an adult child's joblessness.
Historically, youth unemployment leads the broader rate by one to two quarters when the labor market turns. The question is whether the current drift in young-worker joblessness is early warning of a broader softening or a standalone, AI-driven structural shift — both interpretations can be true simultaneously.
Explore Further
Is this happening to you?
Do you know a young person struggling to land their first real job?
How has Youth Unemployment Rate (16-24) changed over time?

Most affected counties
Counties with the highest labor scores in the County Distress Index.
Explore all 3,144 counties →| Period | Value | YoY Change |
|---|---|---|
| May 2026 | 9.4% | −0.3 pts |
| Apr 2026 | 9.5% | −0.1 pts |
| Mar 2026 | 8.5% | −0.9 pts |
| Feb 2026 | 9.5% | −0.2 pts |
| Jan 2026 | 8.9% | −0.2 pts |
| Dec 2025 | 10.4% | +1.4 pts |
| Nov 2025 | 10.6% | +1.2 pts |
| Sep 2025 | 10.4% | +1.2 pts |
| Aug 2025 | 10.6% | +0.9 pts |
| Jul 2025 | 10% | +0.9 pts |
| Jun 2025 | 10% | +1.1 pts |
| May 2025 | 9.7% | +0.4 pts |
Frequently Asked Questions
What is Youth Unemployment Rate (16-24)?
Unemployment rate for workers ages 16 to 24
Why does Youth Unemployment Rate (16-24) matter for financial distress?
Youth Unemployment Rate (16-24) is one of the indicators tracked by the American Distress Index (ADI), which measures five dimensions of U.S. household financial distress: Delinquency, Default & Legal, Debt Burden, Labor, and Safety Net & Buffer. Changes in this indicator contribute to the overall distress picture.
Where does the Youth Unemployment Rate (16-24) data come from?
This data comes from BLS via FRED. More information: https://fred.stlouisfed.org/series/LNS14024887. The American Distress Index updates this indicator monthly.

Quick poll
Is this affecting you or your household?
Discussion
Get the numbers when they move.
New data drops, indicator updates, and ADI score changes — delivered when it matters. No spam.
or Create an Account for full access
Loading comments…