The Adoption Curve
Up from 6.6% a year ago, nearly 3x the rate two years ago
What is the current The Adoption Curve?
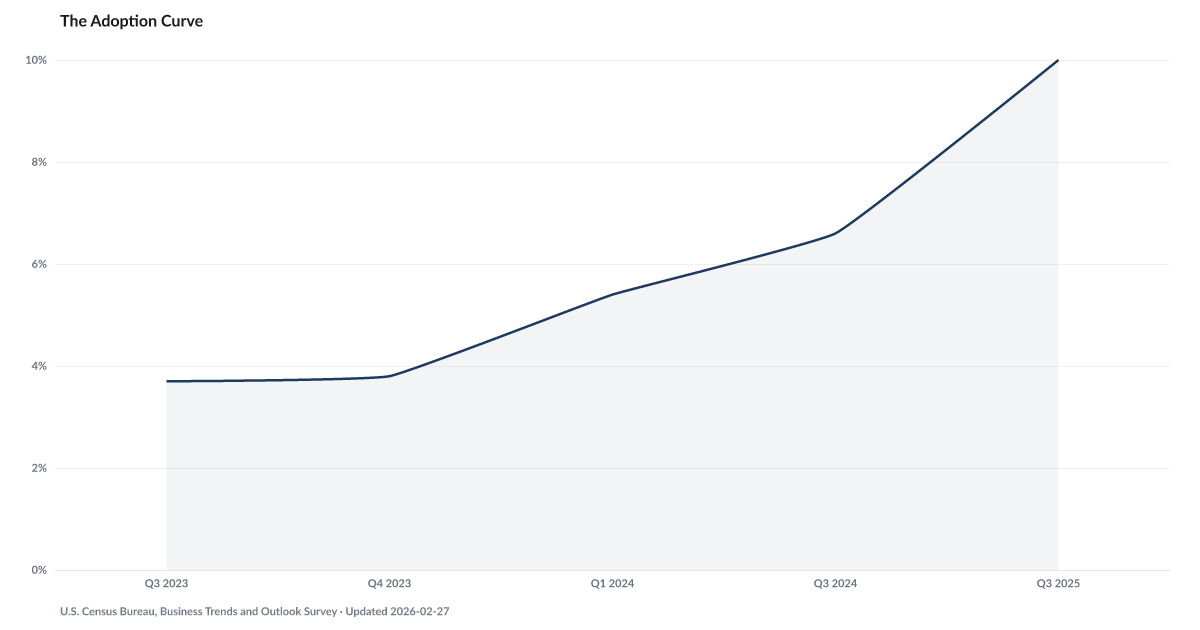
10.0% of U.S. businesses reported using artificial intelligence in any business function as of September 2025, according to the Census Bureau's Business Trends and Outlook Survey (BTOS). AI adoption is a leading indicator of potential workforce displacement and feeds the American Worker Index (AWI). Source: Census BTOS.
10% of U.S. employer businesses now use AI in production — multiples above the share two years earlier, and the adoption curve is still steepening.
The Census Bureau's Business Trends and Outlook Survey reached 10% in its most recent reading (September 2025) for the share of U.S. employer businesses using AI in their operations. Two years earlier, in September 2023, that share was 3.7%. The line has bent upward in each successive reading.
The current level sounds modest until you work through what it represents. The Census BTOS universe is employer firms — roughly 5.8 million businesses that together employ most of the private-sector workforce. A shift of that magnitude in two years is millions of workers whose employer has added AI to production workflows in the last two years.
Adoption is a leading indicator. The workforce consequences show up downstream in series like The AI Cut, where Challenger began tracking AI-attributed layoff announcements as a distinct category that did not exist three years ago, and The Tech Drought, where information-sector job openings have fallen sharply from their 2025 highs. The Horizon tracks the capability side — how long a task AI can complete on its own — and that curve is steeper still.
The adoption curve is the upstream force. When it bends, the hiring data bends a few quarters later. American Default's American Worker Index treats this as the leading edge of AI-related household distress — the mechanism from adoption to displacement to lost income runs through it.
Explore Further
Is this happening to you?
Is your employer rolling out AI tools that change how you do your job?
How has The Adoption Curve changed over time?

Most affected counties
Counties with the highest labor scores in the County Distress Index.
Explore all 3,144 counties →| Period | Value | YoY Change |
|---|---|---|
| Q3 2025 | 10% | +3.4 pts |
| Q3 2024 | 6.6% | +2.9 pts |
| Q1 2024 | 5.4% | — |
| Q4 2023 | 3.8% | — |
| Q3 2023 | 3.7% | — |
Frequently Asked Questions
What percentage of U.S. businesses use AI?
10.0% of U.S. businesses reported using AI in any business function as of September 2025, according to the Census Bureau's Business Trends and Outlook Survey. The rate varies significantly by industry, with technology and finance leading.
Why does AI adoption matter for household financial distress?
Rising AI adoption is a leading indicator of potential workforce displacement. As businesses automate tasks previously performed by humans, workers in affected roles face layoffs, longer job searches, and downward wage pressure.
Where does AI adoption data come from?
The Census Bureau's Business Trends and Outlook Survey (BTOS) is a quarterly survey of U.S. businesses covering current and anticipated use of AI technologies. It is one of the few government-sourced measures of AI adoption.

Quick poll
Is this affecting you or your household?
Discussion
Get the numbers when they move.
New data drops, indicator updates, and ADI score changes — delivered when it matters. No spam.
or Create an Account for full access
Loading comments…