Quarterly benchmark
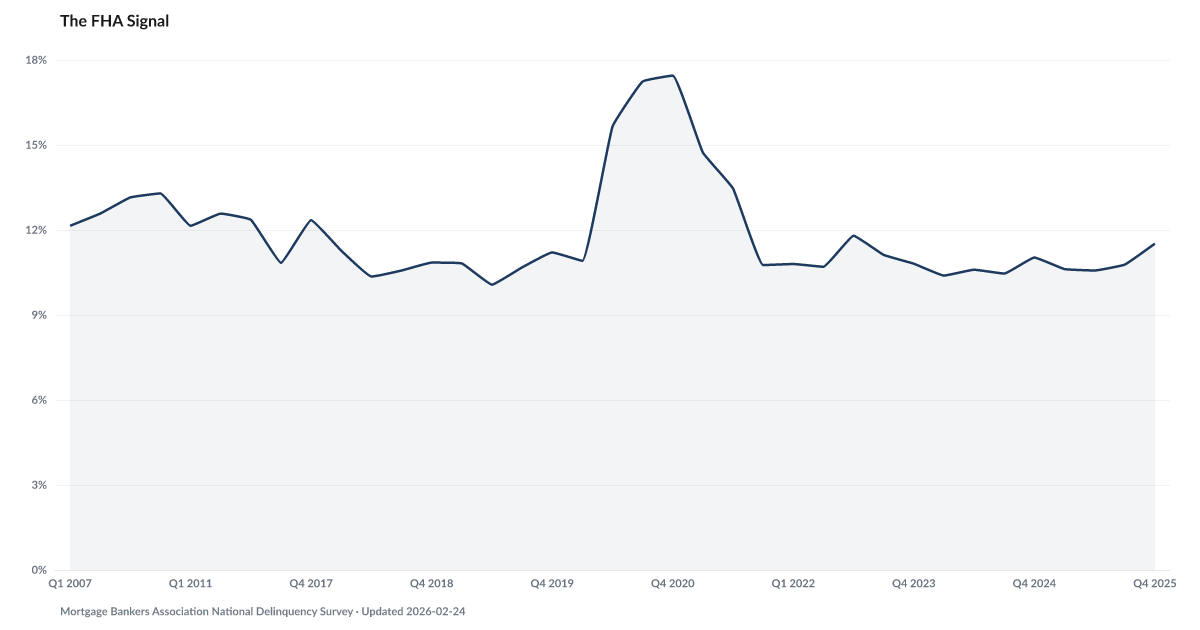
MBA FHA delinquency
11.79% 2026-Q2
Share of FHA loans that are at least one payment past due, excluding loans in foreclosure.
Government-backed loans running at multiples of the bank-booked mortgage rate
FHA delinquency rates hit 11.79% in Q2 2026, according to the Mortgage Bankers Association — 6.3 times the 1.86% bank-booked single-family rate tracked by the Board of Governors of the Federal Reserve System. FHA loans serve first-time buyers with thin financial cushions, making FHA delinquency a leading indicator of broader mortgage distress. The 9.93-point spread between FHA and bank-booked delinquency signals stress concentrated among the most vulnerable borrowers. Source: MBA National Delinquency Survey (Q2 2026).
FHA-insured mortgages — designed for first-time buyers and lower-income households who can't afford large down payments — showed a 11.79% delinquency rate in Q2 2026, according to the Mortgage Bankers Association's National Delinquency Survey. That sits well above the conventional mortgage delinquency rate, leaving a gap of several percentage points between FHA and conventional borrowers.
FHA delinquency functions as a leading indicator of broader mortgage distress because these borrowers have the thinnest financial cushions. They were the first to show strain before the 2008 crisis, too. Falling Behind tracks total delinquency across all loan types, which has been climbing steadily since 2021. The question is whether FHA distress stays concentrated or begins spreading into the conventional market.
The Safety Net reports a national survey measure and does not describe FHA borrowers as a subgroup or predict their mortgage payments. Foreclosure Filings provides separate outcome context rather than evidence of a direct chain from an unexpected expense to foreclosure.
Is this happening to you?
Are you struggling to keep up with your mortgage payment?

MBA supplies the quarterly industry benchmark and headline. The U.S. Department of Housing and Urban Development (HUD), through the Federal Housing Administration, supplies the monthly FHA portfolio monitor. The definitions and seasonal treatment differ, so the observations are displayed together but never joined into one line.
Share of FHA loans that are at least one payment past due, excluding loans in foreclosure.
Share of active loans that are 30 or more days past due, including loans in foreclosure or bankruptcy.
| Period | Value | YoY Change |
|---|---|---|
| Jun 2026 | 13.7% | +1.55 pp |
| May 2026 | 13.49% | +1.87 pp |
| Apr 2026 | 13.09% | — |
| Mar 2026 | 13.23% | — |
| Feb 2026 | 14.19% | — |
| Jan 2026 | 13.77% | — |
| Dec 2025 | 13.97% | — |
| Nov 2025 | 13.74% | — |
| Oct 2025 | 12.04% | — |
| Sep 2025 | 12.56% | — |
| Aug 2025 | 12.51% | — |
| Jul 2025 | 12.18% | — |

| Period | FHA Rate | Conventional Rate | Spread | Ratio |
|---|---|---|---|---|
| Q2 2026 | 11.79% | 1.86% | 9.93 pp | 6.34x |
| Q1 2026 | 11.88% | 1.88% | 10 pp | 6.32x |
| Q4 2025 | 11.52% | 1.79% | 9.73 pp | 6.44x |
| Q3 2025 | 10.78% | 1.78% | 9 pp | 6.06x |
| Q2 2025 | 10.57% | 1.78% | 8.79 pp | 5.94x |
| Q1 2025 | 10.62% | 1.77% | 8.85 pp | 6x |
| Q4 2024 | 11.03% | 1.77% | 9.26 pp | 6.23x |
| Q3 2024 | 10.46% | 1.74% | 8.72 pp | 6.01x |
| Q2 2024 | 10.6% | 1.73% | 8.87 pp | 6.13x |
| Q1 2024 | 10.39% | 1.71% | 8.68 pp | 6.08x |
| Q4 2023 | 10.81% | 1.7% | 9.11 pp | 6.36x |
| Q4 2021 | 10.76% | 2.29% | 8.47 pp | 4.7x |
| Q2 2020 | 15.65% | 2.54% | 13.11 pp | 6.16x |
| Q4 2011 | 12.36% | 10.25% | 2.11 pp | 1.21x |
| Q2 2011 | 12.62% | 10.55% | 2.07 pp | 1.2x |
| Q1 2011 | 12.03% | 10.37% | 1.66 pp | 1.16x |
| Q2 2010 | 13.29% | 11.08% | 2.21 pp | 1.2x |
| Q1 2010 | 13.15% | 11.48% | 1.67 pp | 1.15x |
| Q2 2007 | 12.58% | 2.29% | 10.29 pp | 5.49x |
| Q1 2007 | 12.15% | 2.08% | 10.07 pp | 5.84x |
FHA borrowers who originated in 2020-2022 locked in historically low rates (2.5-4.5%). They cannot refinance without paying dramatically higher rates, trapping them in homes they may no longer afford. This 'rate lock' effect means delinquent FHA borrowers cannot exit through the traditional refinance escape valve. Meanwhile, borrowers who originated in 2022-2023 at higher rates entered with minimal equity (3.5% FHA minimum), giving them the least cushion if home values stagnate.
FHA loan performance varies dramatically by origination year. The 2020–2021 vintage locked in rates between 2.5–3.5% but entered a market where home values have since stagnated or declined in real terms. These borrowers are rate-locked but underwater on purchasing power. The 2022–2023 vintage is worse: they originated at 5.5–7.5% rates with only 3.5% down, meaning their monthly payments consume a larger share of income and they started with almost no equity cushion. HUD Neighborhood Watch data shows that loans originated in 2022–2023 are entering serious delinquency faster than any vintage since 2006–2007. The combination of high rates, minimal equity, and rising cost pressures makes these cohorts the most vulnerable in the current FHA portfolio.
FHA mortgages serve borrowers conventional lenders often decline. First-time buyers, who make up the large majority of FHA purchase loans. Lower-income households. Borrowers with credit scores as low as 580, and those who can only afford the 3.5% minimum down payment. FHA borrowers earn less than conventional borrowers at the median. When household financial stress increases, this population feels it first — and the delinquency data shows it.
FHA delinquency is a leading indicator because it sits upstream of every other distress metric. A borrower who misses a payment enters 30-day delinquency. If they cannot catch up, they progress to 60-day, then 90+ day (serious delinquency). At 120 days the servicer is first allowed to start foreclosure — under federal rules that is the earliest the first filing can be made, not a point at which help arrives on its own. A servicer's duty to review you for options begins when you apply for it. If no workout is agreed, the loan enters foreclosure — a process that takes 6-18 months depending on the state. The current delinquency rate, shown above, sits at the front end of the loss-mitigation and foreclosure process.
In Q1 2007, FHA delinquency stood at 12.15% while the Federal Reserve bank-booked single-family mortgage rate was just 2.08% — a 5.8 times ratio. By Q1 2010, the Fed series had surged to 11.48%. The gap compressed from 10 points to less than 2 as the crisis spread. The current comparison, shown in the live figures above, remains unusually wide by that historical standard. In the 2007-2010 cycle, broader single-family mortgage stress followed the FHA split; the current reading is historical context for tracking whether the gap broadens or compresses over time.
FHA loans are a minority of the outstanding mortgage market by count but account for a disproportionate share of delinquencies. When the MBA reports its blended national delinquency rate, FHA's much higher rate is folded into lower-rate loan segments rather than shown as the whole market. The separate Federal Reserve bank-booked single-family mortgage series, shown above, is lower still, underscoring how much the headline mortgage picture depends on which borrowers and servicers are in view. For policymakers and researchers, FHA delinquency functions as a stress test of the most financially vulnerable homeowners. If FHA borrowers are struggling, the households below them on the income distribution — renters, subprime cardholders, auto loan borrowers — are likely struggling more. The American Distress Index uses FHA delinquency as supporting evidence for the Delinquency domain precisely because it captures distress that blended national statistics hide.
The quarterly headline comes from the Mortgage Bankers Association (MBA) National Delinquency Survey (NDS), the industry benchmark for mortgage performance. The MBA measure is seasonally adjusted and covers FHA loans at least one payment past due while excluding loans in foreclosure. The monthly portfolio monitor comes from U.S. Department of Housing and Urban Development's FHA Single-Family Loan Performance Trends reports. HUD's All Past Due measure is not seasonally adjusted and covers active FHA single-family forward loans at least 30 days past due, including loans in foreclosure and bankruptcy. The two series are displayed separately and are never appended to each other. The comparison mortgage delinquency data comes from the Federal Reserve Board of Governors data retrieved via FRED (series DRSFRMACBS), covering single-family residential mortgages booked in domestic offices at all commercial banks. Historical gaps in the MBA series reflect quarters where a verified public NDS observation is not available; the full NDS dataset requires an MBA subscription.
Counties with the highest delinquency scores in the County Distress Index.
Explore all 3,144 counties →| Period | Value | YoY Change |
|---|---|---|
| Q2 2026 | 11.79% | +1.22 pp |
| Q1 2026 | 11.88% | +1.26 pp |
| Q4 2025 | 11.52% | +0.49 pp |
| Q3 2025 | 10.78% | +0.32 pp |
| Q2 2025 | 10.57% | -0.03 pp |
| Q1 2025 | 10.62% | +0.23 pp |
| Q4 2024 | 11.03% | +0.22 pp |
| Q3 2024 | 10.46% | — |
| Q2 2024 | 10.6% | — |
| Q1 2024 | 10.39% | — |
| Q4 2023 | 10.81% | — |
| Q4 2021 | 10.76% | — |
The FHA mortgage delinquency rate was 11.79% in Q2 2026, according to the Mortgage Bankers Association's National Delinquency Survey. This means roughly one in eight FHA borrowers is behind on payments. For scale: the rate stood at 10.46% in Q3 2024.
FHA-insured mortgages serve first-time buyers and lower-income households who make smaller down payments (as low as 3.5%) and have thinner financial cushions. The median FHA borrower income is roughly $20,000 below the conventional borrower median. These borrowers are the first to show strain when costs rise or income disruption occurs. The current 6.3 times gap between FHA (11.79%) and the bank-booked single-family rate (1.86%) measures how unevenly that strain is distributed.
Historically, yes. In Q1 2007, FHA delinquency stood at 12.15% while the Federal Reserve's bank-booked single-family rate was just 2.08% — a 5.8 times ratio. By Q1 2010, the bank-booked rate had surged to 11.48% and the gap compressed to under 2 points. FHA borrowers showed stress 2-3 years before the broader market. The current 6.3 times ratio is being closely watched for the same pattern.
The current FHA-to-bank-booked spread is 9.93 percentage points (11.79% vs 1.86%), with a 6.3 times ratio. In Q1 2007, the spread was 10.07 points with a 5.8 times ratio. During the 2008-2010 crisis, the spread compressed to under 2 points as bank-booked delinquency surged to match FHA levels.
FHA borrowers who originated in 2020-2022 locked in historically low rates (2.5-4.5%). They cannot refinance without paying dramatically higher rates, trapping them in homes they may no longer afford. This eliminates the traditional refinance escape valve. Meanwhile, 2022-2023 vintage borrowers entered with minimal equity (3.5% FHA minimum down payment), giving them the least cushion if home values stagnate.
Delinquent FHA loans feed directly into the foreclosure pipeline. At 120 days a servicer is first allowed to start foreclosure — under federal rules that is the earliest the first filing can be made, not a point at which help arrives on its own. A servicer's duty to review you for options begins when you apply for it. If no workout is agreed, the loan enters foreclosure — a process taking 6-18 months depending on the state. The American Distress Index tracks foreclosure filings separately, downstream of the 11.79% FHA delinquency rate.
About 83% of FHA purchase loans go to first-time homebuyers, according to HUD's Annual Report to Congress on the FHA Mutual Mortgage Insurance Fund. FHA borrowers typically have credit scores as low as 580, make the minimum 3.5% down payment, and earn roughly $20,000 less per year than conventional borrowers. FHA mortgages are designed to expand homeownership access — but that means FHA borrowers have the thinnest financial margins and are most exposed to economic stress.
The primary source is the Mortgage Bankers Association's quarterly National Delinquency Survey, the industry benchmark for mortgage performance data. Supplementary monthly data comes from HUD's Single-Family Loan Performance Trends reports. The American Distress Index tracks both sources to monitor FHA delinquency as a leading indicator of household financial distress.
Contact your servicer immediately — FHA loans have loss mitigation options including repayment plans, forbearances, standalone partial claims, standalone loan modifications, combination loan modifications with partial claims, and Payment Supplement. Call HUD's free housing counselor hotline at 1-800-569-4287 for expert guidance. Acting early gives you the most options. See our foreclosure prevention guide at americandefault.org/help/foreclosure/stop-foreclosure/ for step-by-step instructions.
Loans originated in 2022-2023 are entering serious delinquency faster than any vintage since 2006-2007, according to HUD Neighborhood Watch data. These borrowers originated at 5.5-7.5% rates with only 3.5% down payment, meaning high monthly payments and minimal equity cushion. The 2020-2021 vintage has a different problem: borrowers locked in low rates (2.5-3.5%) but are now rate-locked, unable to refinance their way out of financial difficulty.
The MBA's blended national delinquency rate folds FHA (11.79%), VA, and conventional loans into a single number. The blend obscures a two-tier mortgage market: the Federal Reserve's bank-booked single-family rate sits at 1.86% while FHA runs 6.3 times higher. The American Distress Index tracks FHA separately to reveal distress that aggregate statistics hide.
Quick poll
Is this affecting you or your household?
New data drops, indicator updates, and ADI score changes — delivered when it matters. No spam.
or Create an Account for full access


Loading comments…