Foreclosure Filings
Foreclosure activity across U.S. properties
What is the current Foreclosure Filings reading?
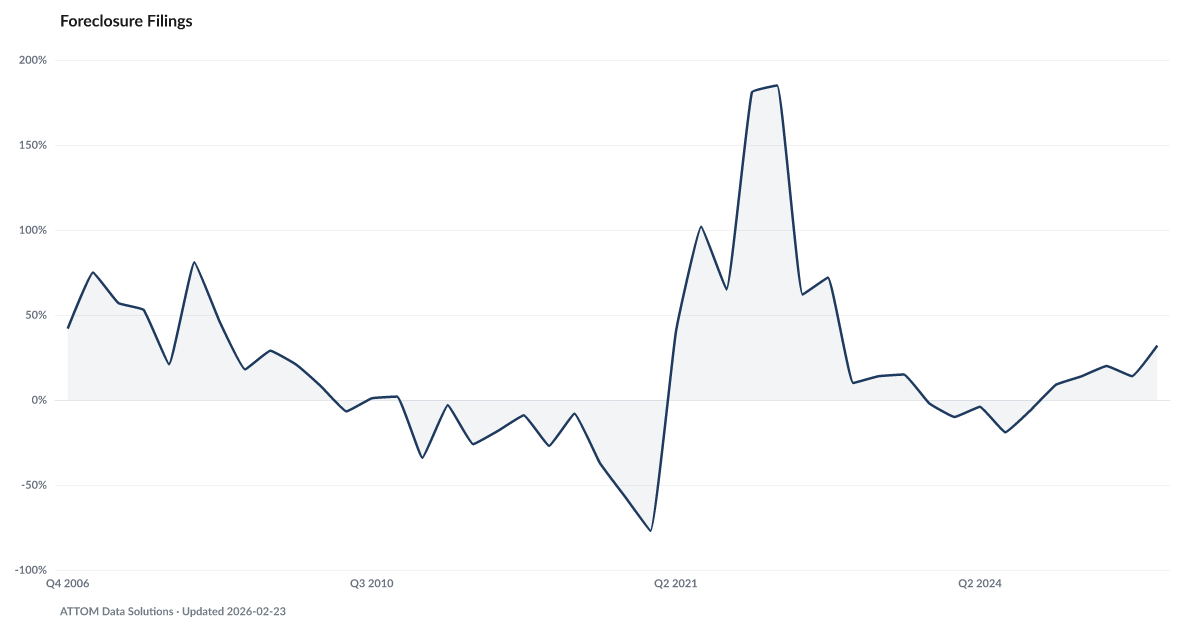
Foreclosure Filings YoY Change: 15% as of 2026-Q2. Source: ATTOM Data Solutions.
Foreclosure filings changed 15% year over year in Q2 2026, according to ATTOM Data Solutions.
This series reports the year-over-year change in filings, not the filing count. ATTOM Data Solutions puts that change at 15% for Q2 2026. Movement in this rate is acceleration or deceleration against the same quarter a year earlier; it does not establish that the underlying number of filings rose or fell from the quarter before.
Foreclosure filings, mortgage delinquencies, and completed foreclosures are separate measures. The FHA Signal reports delinquency rates, while this indicator reports properties receiving a default notice, scheduled auction, or bank repossession. Neither series by itself establishes how many cases will become completed foreclosures or future housing inventory.
Bankruptcy Filings report a separate legal filing count, while the Chapter 7-to-Chapter 13 filing ratio describes the composition of those cases. Neither measure establishes a household's motive, repayment capacity, or reason for using one bankruptcy chapter.
Explore Further
Is this happening to you?
Have you received any notices from your mortgage servicer that worried you?
How has Foreclosure Filings changed over time?

Most affected counties
Counties with the highest default and legal scores in the County Distress Index.
Explore all 3,144 counties →| Period | Value | YoY Change |
|---|---|---|
| Q2 2026 | 15% | +2 pp |
| Q1 2026 | 32% | +34 pp |
| Q4 2025 | 32% | +40.7 pp |
| Q3 2025 | 17% | +33 pp |
| Q2 2025 | 13% | +17 pp |
| Q1 2025 | -2% | -1.2 pp |
| Q4 2024 | -8.7% | -6.7 pp |
| Q3 2024 | -16% | -28 pp |
| Q2 2024 | -4% | -15 pp |
| Q1 2024 | -0.8% | -14.5 pp |
| Q4 2023 | -2% | -64 pp |
| Q3 2023 | 12% | -82.7 pp |
Frequently Asked Questions
What is Foreclosure Filings YoY Change?
Foreclosure activity across U.S. properties
Why does Foreclosure Filings YoY Change matter for financial distress?
Foreclosure Filings YoY Change is one of the indicators tracked by the American Distress Index (ADI), which measures five dimensions of U.S. household financial distress: Delinquency, Default & Legal, Debt Burden, Labor, and Safety Net & Buffer. Changes in this indicator contribute to the overall distress picture.
Where does the Foreclosure Filings YoY Change data come from?
This data comes from ATTOM Data Solutions. More information: https://www.attomdata.com/news/market-trends/. The American Distress Index updates this indicator quarterly.


Quick poll
Is this affecting you or your household?
Discussion
Get the numbers when they move.
New data drops, indicator updates, and ADI score changes — delivered when it matters. No spam.
or Create an Account for full access
Loading comments…