The Wipeout Ratio
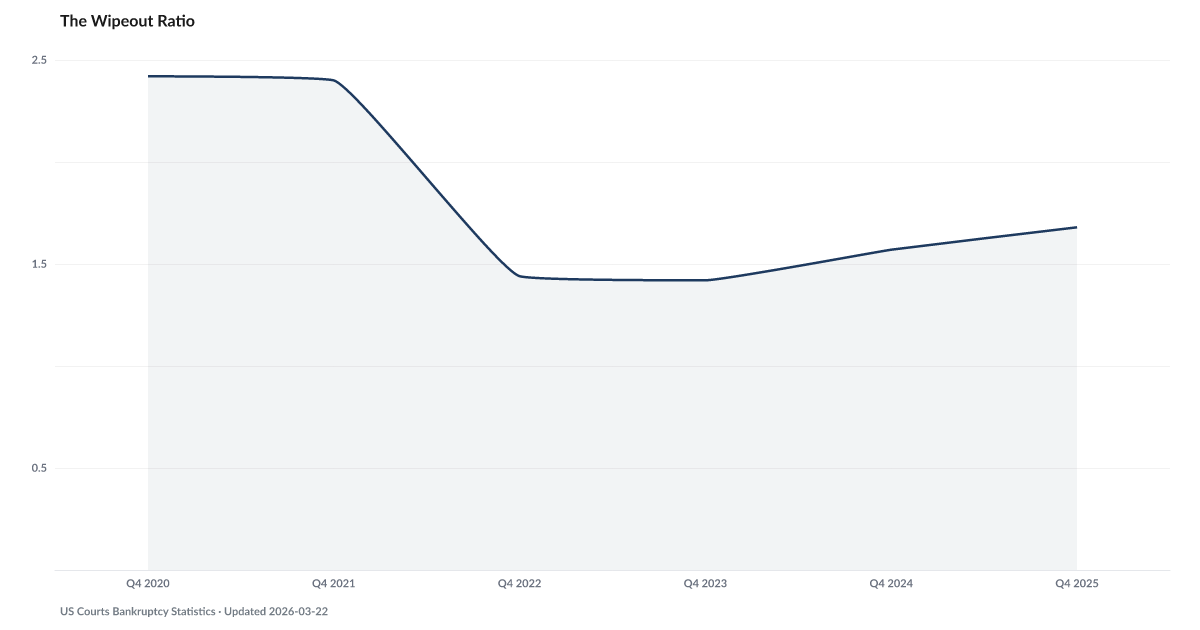
Ratio of Chapter 7 liquidation to Chapter 13 reorganization filings
What is the current Wipeout Ratio reading?
The ratio of Chapter 7 to Chapter 13 filings was 1.8 times for the rolling-year period ending Q2 2026. The ratio describes filing composition and does not establish filers' motives, income, assets, repayment capacity, or case outcomes. Source: Administrative Office of the U.S. Courts, Table F-2.
The Chapter 7-to-Chapter 13 filing ratio was 1.8 times for the rolling-year period ending Q2 2026.
Administrative Office of the U.S. Courts Table F-2 reports rolling-year filing totals by chapter. Dividing the Chapter 7 total by the Chapter 13 total produces 1.8 times for Q2 2026.
The ratio describes filing composition, not household condition. It does not establish why a filer used Chapter 7 or Chapter 13, whether a repayment plan was feasible, or how filers' income, assets, debts, or case outcomes changed.
The ratio is descriptive and bidirectional in the direction inventory. A forecast or claim about household causes would require a separate model or linked case-level evidence; Table F-2 alone supports neither.
Explore Further
Is this happening to you?
If you had to file bankruptcy, would you want to keep your assets or start fresh?
How has The Wipeout Ratio changed over time?

Most affected counties
Counties with the highest default and legal scores in the County Distress Index.
Explore all 3,144 counties →| Period | Value | YoY Change |
|---|---|---|
| Q2 2026 | 1.77x | +0.11x |
| Q1 2026 | 1.75x | +0.14x |
| Q4 2025 | 1.72x | +0.15x |
| Q3 2025 | 1.7x | +0.18x |
| Q2 2025 | 1.66x | +0.18x |
| Q1 2025 | 1.61x | +0.16x |
| Q4 2024 | 1.57x | +0.15x |
| Q3 2024 | 1.52x | +0.12x |
| Q2 2024 | 1.48x | +0.1x |
| Q1 2024 | 1.45x | — |
| Q4 2023 | 1.42x | — |
| Q3 2023 | 1.4x | — |
Frequently Asked Questions
What is the Chapter 7 to Chapter 13 bankruptcy ratio?
The ratio was 1.8 times for the rolling-year period ending Q2 2026. It divides the Chapter 7 filing total by the Chapter 13 filing total for the same reporting window.
What is the difference between Chapter 7 and Chapter 13 bankruptcy?
Chapter 7 is the liquidation chapter of the Bankruptcy Code; a trustee may liquidate non-exempt assets and eligible debts may be discharged. Chapter 13 provides a court-supervised repayment process. Eligibility and outcomes depend on facts not contained in Table F-2.
Why is a rising ratio significant?
A change in the ratio shows that the mix of Chapter 7 and Chapter 13 filings changed. It does not by itself establish a change in filers' income, debts, financial condition, or reasons for filing.
What does the wipeout ratio predict?
This ratio is descriptive, not a prediction. Table F-2 reports filed cases by chapter; a forecast would require a separate model with a stated horizon, vintage, assumptions, and uncertainty.
Where does the Chapter 7 vs. Chapter 13 data come from?
The Administrative Office of the U.S. Courts publishes Table F-2 quarterly. American Default Research computes the ratio from Chapter 7 and Chapter 13 rolling-year filing totals for the same quarter end.


Quick poll
Is this affecting you or your household?
Discussion
Get the numbers when they move.
New data drops, indicator updates, and ADI score changes — delivered when it matters. No spam.
or Create an Account for full access
Loading comments…