SNAP (Food Stamp) Enrollment
37,870,817 people enrolled in SNAP in February 2026
What is the current SNAP (Food Stamp) Enrollment?
SNAP (Food Stamp) Enrollment: 37,870,817 as of 2026-02, and improving. Source: USDA Food and Nutrition Service.
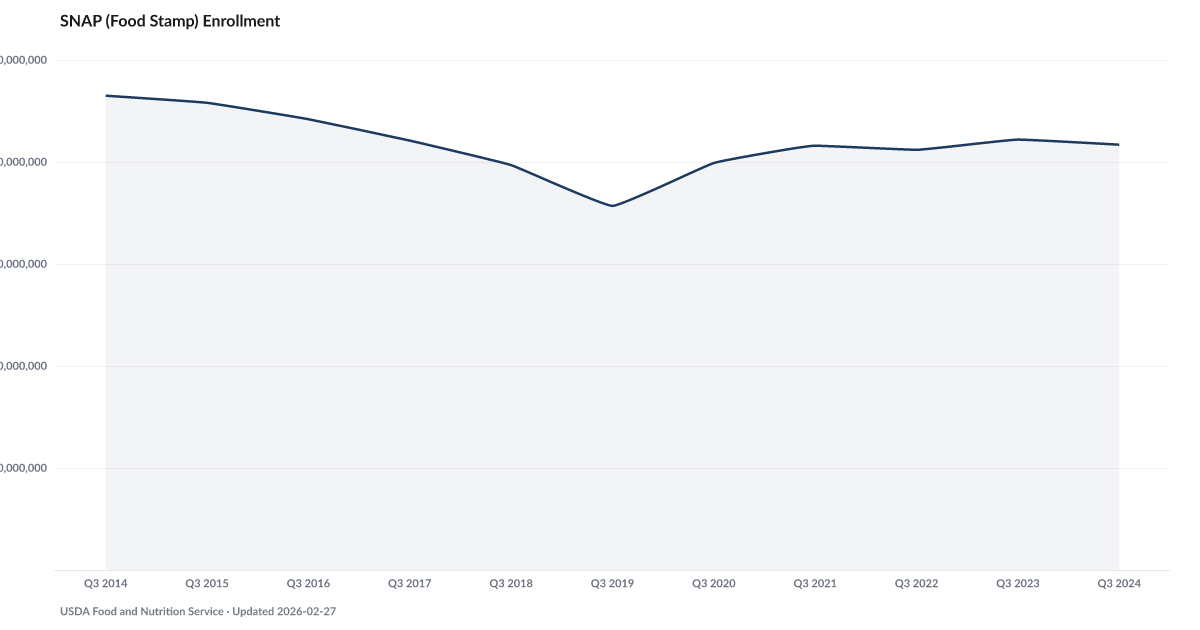
SNAP enrollment remains well above its pre-pandemic baseline, and is holding there while the headline labor market keeps expanding.
The USDA Food and Nutrition Service publishes monthly SNAP enrollment data. The September 2019 reading, just before the pandemic, was 35.7 million. Enrollment surged through 2020 and 2021 and has not returned to pre-pandemic levels. Several million additional Americans are using food assistance today than before the pandemic, and the rolls have stopped falling.
That persistence is the point. SNAP enrollment is means-tested. Eligibility depends on income relative to the federal poverty line. For enrollment to stay well above pre-pandemic levels five years later, the share of households below the income thresholds has to be structurally higher — either because wages have not kept up with costs, or because the cost of qualifying expenses like rent and child care has pushed more households across the eligibility line.
The official unemployment rate has been under 5% for most of this window. The headline economy is not in recession. And yet the number of households qualifying for grocery help keeps climbing.
SNAP is a leading indicator for the distress the American Distress Index tracks. It measures the share of households that have already run out of runway on food — the most elastic line in the household budget. The Buffer and The Safety Net measure the reserves that should prevent a household from needing SNAP in the first place. Both are near historic lows. The enrollment plateau is what that looks like on the ground.
Explore Further
How has SNAP (Food Stamp) Enrollment changed over time?

Most affected counties
Counties with the highest debt burden scores in the County Distress Index.
Explore all 3,144 counties →| Period | Value | YoY Change |
|---|---|---|
| Feb 2026 | 37,870,817 | −4309706.00 |
| Jan 2026 | 38,535,642 | −4292810.00 |
| Dec 2025 | 39,205,146 | −3752233.00 |
| Nov 2025 | 39,997,940 | −3023642.00 |
| Oct 2025 | 41,091,800 | +923716.00 |
| Sep 2025 | 41,633,090 | +2350239.00 |
| Aug 2025 | 41,836,900 | −380857.00 |
| Jul 2025 | 42,012,830 | −14702.00 |
| Jun 2025 | 42,084,880 | +219302.00 |
| May 2025 | 42,248,301 | +449465.00 |
| Apr 2025 | 42,353,149 | +741004.00 |
| Mar 2025 | 42,193,855 | +621883.00 |
Frequently Asked Questions
What is SNAP (Food Stamp) Enrollment?
37,870,817 people enrolled in SNAP in February 2026
Why does SNAP (Food Stamp) Enrollment matter for financial distress?
SNAP (Food Stamp) Enrollment is one of the indicators tracked by the American Distress Index (ADI), which measures five dimensions of U.S. household financial distress: Delinquency, Default & Legal, Debt Burden, Labor, and Safety Net & Buffer. Changes in this indicator contribute to the overall distress picture.
Where does the SNAP (Food Stamp) Enrollment data come from?
This data comes from USDA Food and Nutrition Service. More information: https://www.fns.usda.gov/pd/supplemental-nutrition-assistance-program-snap. The American Distress Index updates this indicator monthly.

Quick poll
Is this affecting you or your household?
Discussion
Get the numbers when they move.
New data drops, indicator updates, and ADI score changes — delivered when it matters. No spam.
or Create an Account for full access
Loading comments…