Prescription Drug CPI
Year-over-year change in prescription drug prices
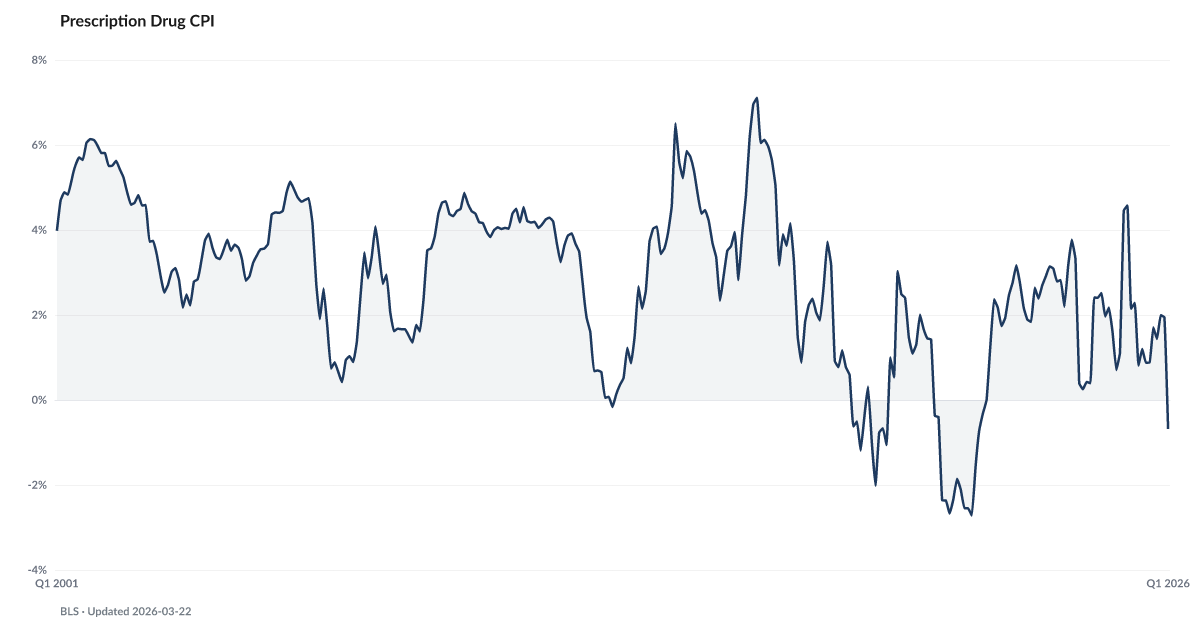
What is the current Prescription Drug CPI?
The prescription drug Consumer Price Index registered -2.0% year-over-year in May 2026, one of the few consumer categories showing deflation. Headline negotiated prices have eased, but out-of-pocket drug costs remain a significant burden for uninsured and high-deductible households. Source: BLS via FRED (CUSR0000SEMF01).
Prescription drug prices are running at -2% year-over-year — a CPI category where Medicare negotiation and generic substitution both show up in the index.
Drug prices almost never fall. The prescription drug component of the Consumer Price Index has been positive for roughly 95 percent of the past thirty years, with annual gains typically between 2 and 5 percent. The curve is persistent and predictable.
BLS data shows the year-over-year change at -2% as of May 2026. The print reflects two regulatory levers running at the same time. Medicare negotiation on a widening list of drugs is feeding through to the price indexes. Generic substitution on several high-volume brand franchises is arriving in parallel.
This is a genuine bright spot, rare enough in the Cost Pressure set that it deserves naming. But the relief is concentrated in the drugs that are on-patent-coming-off and in the categories Medicare is negotiating. Patients on novel biologics, weight-loss drugs, or specialty cancer therapies face price curves that look nothing like the headline number.
The broader context is sobering. Medical Care CPI is still running well above the headline pace. Doctor visits, hospital services, and insurance premiums are doing the work of keeping total healthcare inflation positive. Drug deflation is helpful. It's also the smallest line in the medical budget for most households who aren't on a specialty therapy.
Explore Further
How has Prescription Drug CPI changed over time?

Most affected counties
Counties with the highest debt burden scores in the County Distress Index.
Explore all 3,144 counties →| Period | Value | YoY Change |
|---|---|---|
| May 2026 | -2.02% | −2.8 pts |
| Apr 2026 | -0.52% | −2.8 pts |
| Mar 2026 | -0.18% | −2.3 pts |
| Feb 2026 | -0.7% | −5.3 pts |
| Jan 2026 | -0.53% | −5.0 pts |
| Dec 2025 | 1.95% | +0.8 pts |
| Nov 2025 | 1.86% | +1.2 pts |
| Sep 2025 | 1.71% | −0.5 pts |
| Aug 2025 | 0.88% | −1.1 pts |
| Jul 2025 | 0.88% | −1.6 pts |
| Jun 2025 | 1.2% | −1.2 pts |
| May 2025 | 0.81% | −1.6 pts |
Frequently Asked Questions
Are prescription drug prices falling?
The BLS prescription drug CPI registered -2.0% year-over-year in May 2026. The headline reflects negotiated prices — many consumers without insurance or with high-deductible plans still face rising out-of-pocket costs.
Why track prescription drug prices?
Drug costs are non-discretionary for people with chronic conditions. When Rx prices rise faster than income, households may skip medications — tracked by the American Distress Index as a healthcare access signal.
Where does this data come from?
Published monthly by the Bureau of Labor Statistics, series CUSR0000SEMF01.

Quick poll
Is this affecting you or your household?
Discussion
Get the numbers when they move.
New data drops, indicator updates, and ADI score changes — delivered when it matters. No spam.
or Create an Account for full access
Loading comments…