Grocery Prices Cumulative Change Since Jan 2020
Tracking worsening relative to recent baseline.
What is the current Grocery Prices Cumulative Change Since Jan 2020?
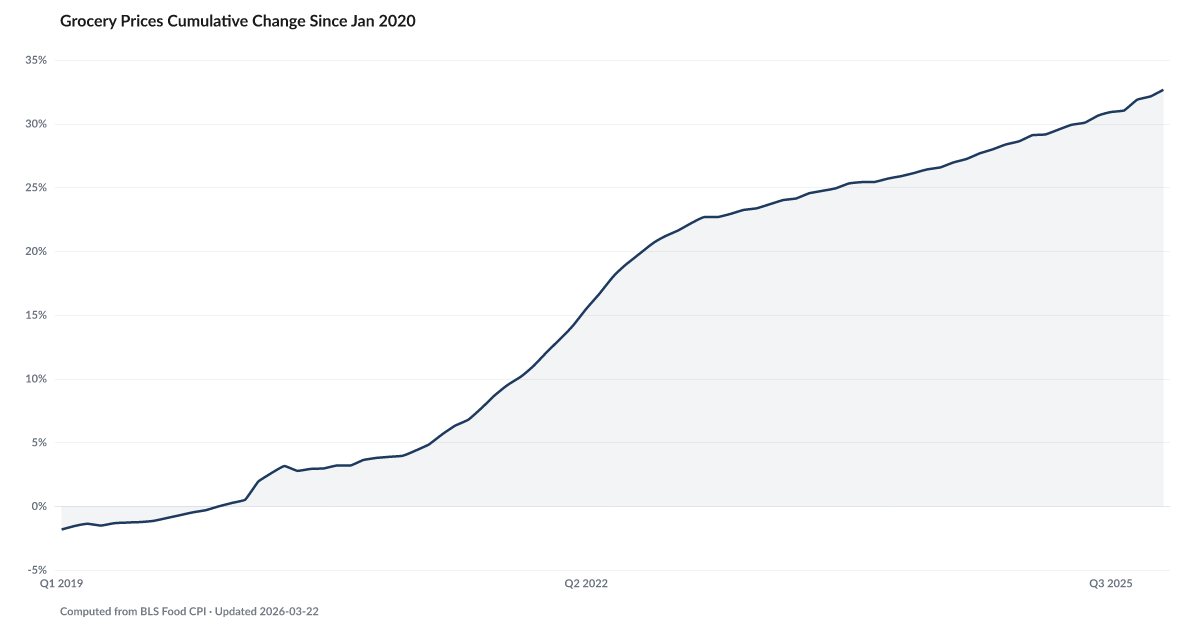
Grocery prices have risen 32.14% cumulatively since January 2020, according to BLS Consumer Price Index data for food at home. Even as the year-over-year inflation rate has moderated from its 2022 peak, the cumulative price increase remains locked in — prices do not decline, they simply rise more slowly. For a family spending $200 per week on groceries in 2020, the same basket now costs approximately $264. Source: BLS CPI (Food at Home).
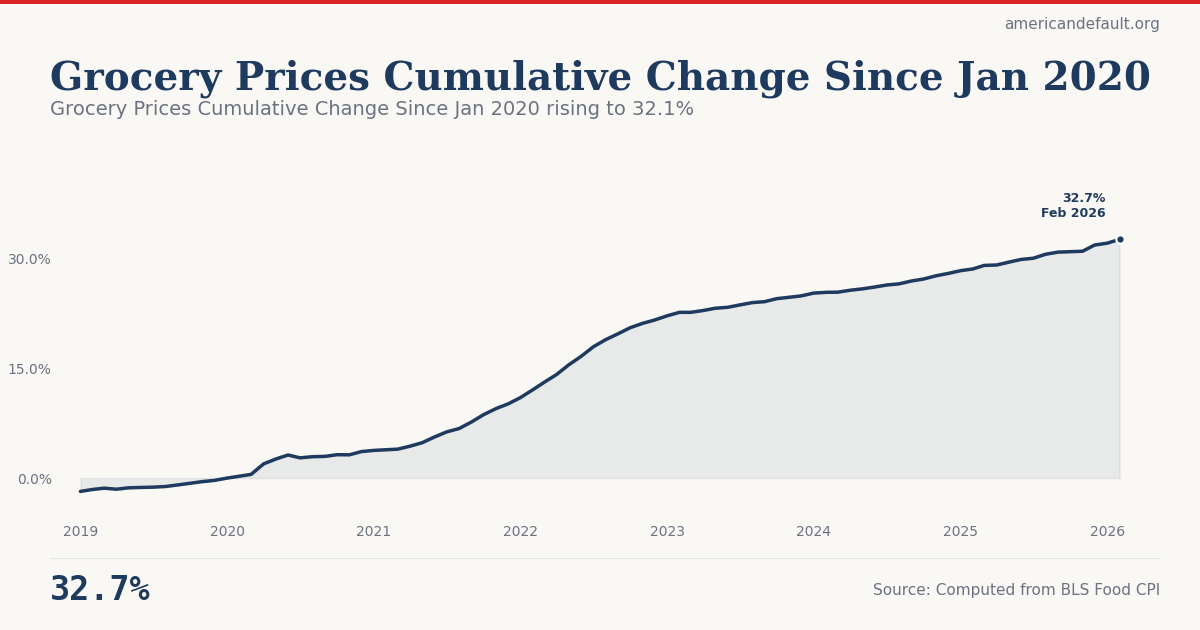
Grocery Prices Cumulative Change Since Jan 2020 rising to 32.1%
Tracking worsening relative to recent baseline.
Explore Further
Is this happening to you?
Does your grocery bill feel permanently higher than it was before 2020?
How has Grocery Prices Cumulative Change Since Jan 2020 changed over time?

| Period | Value | YoY Change |
|---|---|---|
| Feb 2026 | 32.66% | +4.0 pts |
| Jan 2026 | 32.14% | +3.8 pts |
| Dec 2025 | 31.89% | +3.9 pts |
| Nov 2025 | 31.04% | +3.4 pts |
| Sep 2025 | 30.92% | +4.0 pts |
| Aug 2025 | 30.63% | +4.1 pts |
| Jul 2025 | 30.08% | +3.7 pts |
| Jun 2025 | 29.92% | +3.8 pts |
| May 2025 | 29.54% | +3.6 pts |
| Apr 2025 | 29.16% | +3.5 pts |
| Mar 2025 | 29.1% | +3.7 pts |
| Feb 2025 | 28.62% | +3.2 pts |
Frequently Asked Questions
How much have grocery prices risen since the pandemic?
Grocery prices (food at home) have risen 32.14% cumulatively since January 2020, according to BLS CPI data. This means a grocery bill of $200 in January 2020 now costs approximately $264 for the same items.
Why does cumulative price change matter more than the inflation rate?
The inflation rate measures how fast prices are rising currently. Cumulative change measures the total damage. Even if inflation slows to 2%, the 32% price increase that already occurred remains permanent. Wages would need to have risen by a comparable amount for households to maintain their purchasing power — and for lower-income workers, they have not.
Where does grocery price data come from?
The Bureau of Labor Statistics publishes the Consumer Price Index for food at home monthly, measuring average price changes across a basket of grocery items. American Default computes the cumulative change from January 2020 as a baseline.
Quick poll
Is this affecting you or your household?
Discussion
Get the numbers when they move.
New data drops, indicator updates, and ADI score changes — delivered when it matters. No spam.
or Create an Account for full access
Loading comments…