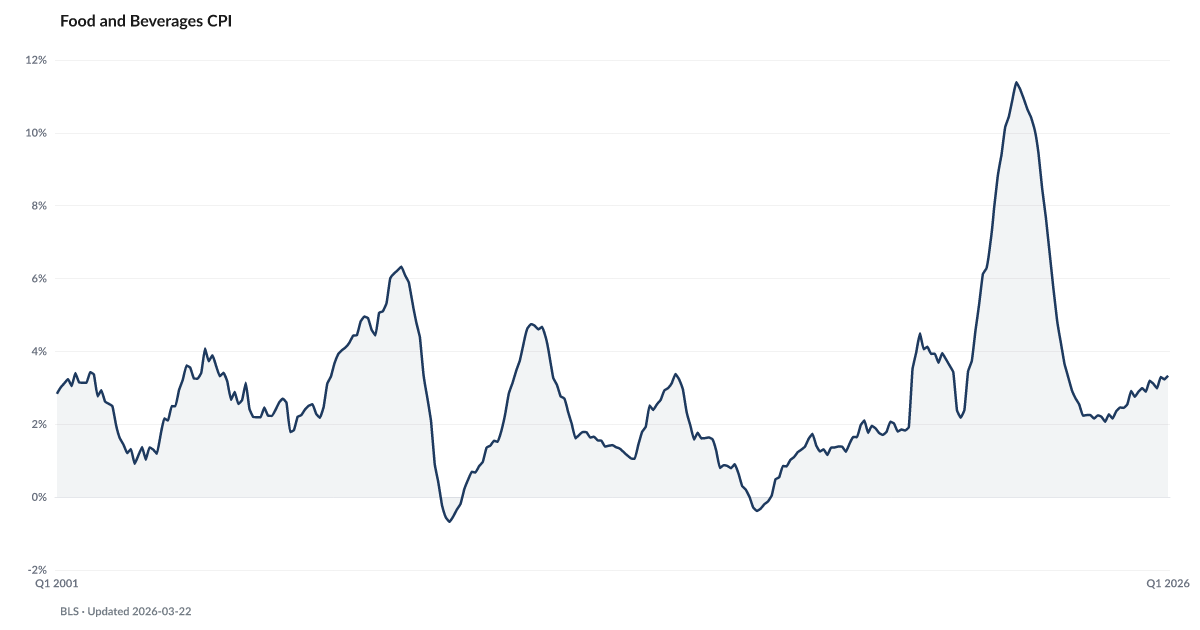
Food and Beverages CPI
Year-over-year change in food and beverage prices
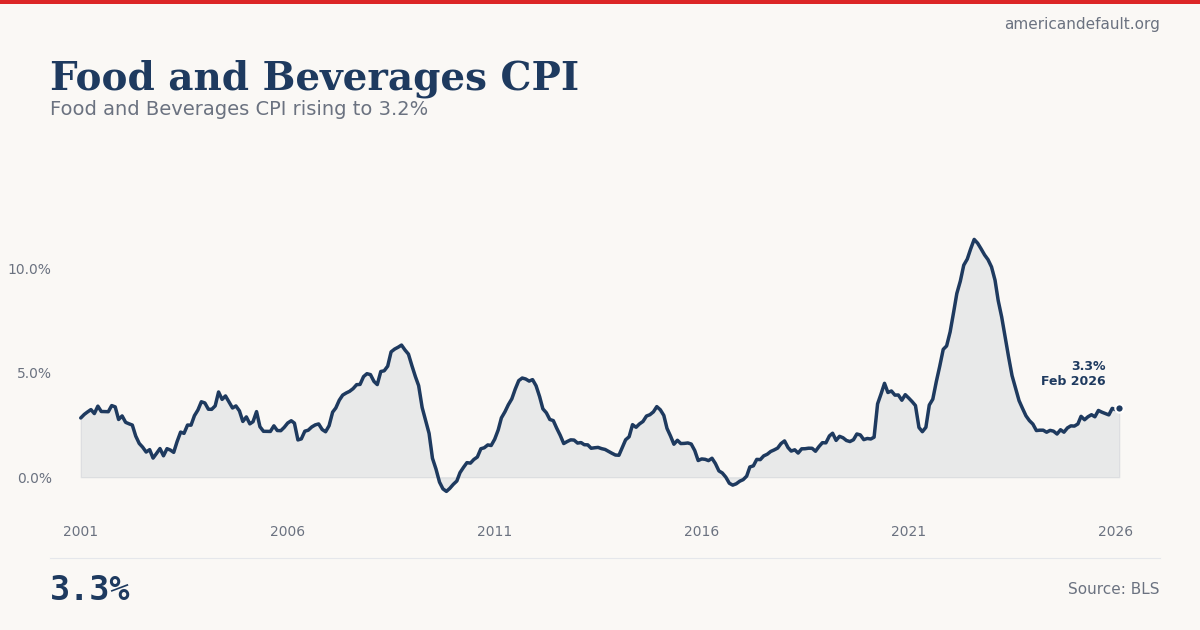
What is the current Food and Beverages CPI?
The food-at-home Consumer Price Index rose 3.33% year-over-year in the latest reading, according to the Bureau of Labor Statistics. Grocery prices continue to outpace overall inflation, compounding a cumulative 32.7% increase since January 2020. Food costs disproportionately burden lower-income households who spend a larger share of income on groceries. Source: BLS (CUSR0000SAF1).
Food and Beverages CPI rising to 3.2%
Tracking worsening relative to recent baseline.
Explore Further
How has Food and Beverages CPI changed over time?

| Period | Value | YoY Change |
|---|---|---|
| Feb 2026 | 3.33% | +0.8 pts |
| Jan 2026 | 3.23% | +0.8 pts |
| Dec 2025 | 3.3% | +0.8 pts |
| Nov 2025 | 2.98% | +0.6 pts |
| Sep 2025 | 3.11% | +0.8 pts |
| Aug 2025 | 3.2% | +1.1 pts |
| Jul 2025 | 2.89% | +0.7 pts |
| Jun 2025 | 2.99% | +0.7 pts |
| May 2025 | 2.9% | +0.7 pts |
| Apr 2025 | 2.75% | +0.5 pts |
| Mar 2025 | 2.92% | +0.7 pts |
| Feb 2025 | 2.55% | +0.3 pts |
Frequently Asked Questions
How fast are grocery prices rising?
Food-at-home prices rose 3.33% year-over-year in the latest BLS report. Cumulatively, grocery prices are up 32.7% since January 2020.
Why does food inflation matter for financial distress?
Food is non-discretionary spending. When grocery costs rise faster than wages, households must cut other spending or take on debt to eat — a direct driver of the financial distress the ADI tracks.
Where does food CPI data come from?
Published monthly by the Bureau of Labor Statistics as part of the CPI report, series CUSR0000SAF1 (food at home).
Quick poll
Is this affecting you or your household?
Discussion
Get the numbers when they move.
New data drops, indicator updates, and ADI score changes — delivered when it matters. No spam.
or Create an Account for full access
Loading comments…