California County Distress Index
Financial distress scores for all 58 counties in California, scored 0–100 across five domains. Mean score: 55.0. 14counties are in Serious Stress or Crisis.
Data: Census, BLS, Urban Institute, HUD, US Courts | Scores as of 2026-03-17
California Snapshot
California County Map
Loading interactive map…
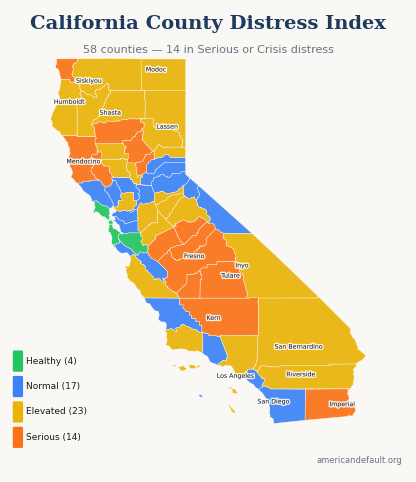
All 58 California counties colored by distress zone. Hover for details; click released counties for full reports.
Most & Least Distressed
Most Distressed
Least Distressed
Score Distribution
How California's 58 county scores are distributed across the 0–100 scale.
All California Counties
58 counties ranked by distress score. Click column headers to sort.
| State Rank | Nat'l Rank | County | Score | Zone | Primary Driver |
|---|---|---|---|---|---|
| 1 | 99 | Lake County | 73.2 | Serious Stress | Employment & Wages |
| 2 | 137 | Merced County | 71.7 | Serious Stress | Employment & Wages |
| 3 | 170 | Imperial County | 70.9 | Serious Stress | Housing Cost Burden |
| 4 | 179 | Butte County | 70.7 | Serious Stress | Housing Cost Burden |
| 5 | 187 | Tehama County | 70.5 | Serious Stress | Employment & Wages |
| 6 | 219 | Madera County | 69.8 | Serious Stress | Employment & Wages |
| 7 | 220 | Kings County | 69.8 | Serious Stress | Employment & Wages |
| 8 | 253 | Kern County | 69.1 | Serious Stress | Housing Cost Burden |
| 9 | 259 | Tulare County | 68.9 | Serious Stress | Employment & Wages |
| 10 | 315 | Fresno County | 67.9 | Serious Stress | Housing Cost Burden |
| 11 | 334 | Yuba County | 67.6 | Serious Stress | Housing Cost Burden |
| 12 | 357 | Del Norte County | 67.3 | Serious Stress | Employment & Wages |
| 13 | 362 | Mendocino County | 67.2 | Serious Stress | Employment & Wages |
| 14 | 482 | Mariposa County | 65.3 | Serious Stress | Employment & Wages |
| 15 | 499 | Modoc County | 65.0 | Elevated | Income & Poverty |
| 16 | 544 | Humboldt County | 64.2 | Elevated | Housing Cost Burden |
| 17 | 551 | Siskiyou County | 64.2 | Elevated | Housing Cost Burden |
| 18 | 624 | Trinity County | 63.0 | Elevated | Income & Poverty |
| 19 | 666 | Shasta County | 62.4 | Elevated | Housing Cost Burden |
| 20 | 741 | Sutter County | 61.2 | Elevated | Housing Cost Burden |
| 21 | 742 | Tuolumne County | 61.1 | Elevated | Housing Cost Burden |
| 22 | 768 | Glenn County | 60.9 | Elevated | Employment & Wages |
| 23 | 774 | San Bernardino County | 60.8 | Elevated | Housing Cost Burden |
| 24 | 804 | Monterey County | 60.4 | Elevated | Housing Cost Burden |
| 25 | 821 | Lassen County | 60.1 | Elevated | Employment & Wages |
| 26 | 872 | Stanislaus County | 59.5 | Elevated | Housing Cost Burden |
| 27 | 926 | Plumas County | 58.6 | Elevated | Employment & Wages |
| 28 | 993 | Calaveras County | 58.0 | Elevated | Employment & Wages |
| 29 | 1,073 | Sierra County | 57.2 | Elevated | Employment & Wages |
| 30 | 1,109 | Santa Barbara County | 56.5 | Elevated | Housing Cost Burden |
| 31 | 1,140 | Riverside County | 56.0 | Elevated | Housing Cost Burden |
| 32 | 1,152 | San Joaquin County | 55.9 | Elevated | Housing Cost Burden |
| 33 | 1,188 | Colusa County | 55.2 | Elevated | Employment & Wages |
| 34 | 1,242 | Los Angeles County | 54.6 | Elevated | Housing Cost Burden |
| 35 | 1,517 | Amador County | 50.9 | Elevated | Employment & Wages |
| 36 | 1,541 | Solano County | 50.7 | Elevated | Housing Cost Burden |
| 37 | 1,588 | Inyo County | 50.1 | Elevated | Employment & Wages |
| 38 | 1,619 | Yolo County | 49.6 | Normal | Housing Cost Burden |
| 39 | 1,624 | Sacramento County | 49.6 | Normal | Housing Cost Burden |
| 40 | 1,659 | San Luis Obispo County | 49.2 | Normal | Housing Cost Burden |
| 41 | 1,685 | Santa Cruz County | 48.8 | Normal | Housing Cost Burden |
| 42 | 1,699 | Ventura County | 48.6 | Normal | Housing Cost Burden |
| 43 | 1,756 | Alpine County | 47.9 | Normal | Employment & Wages |
| 44 | 1,825 | San Benito County | 47.0 | Normal | Employment & Wages |
| 45 | 1,873 | San Diego County | 46.3 | Normal | Housing Cost Burden |
| 46 | 2,010 | Nevada County | 44.8 | Normal | Housing Cost Burden |
| 47 | 2,107 | Napa County | 43.7 | Normal | Housing Cost Burden |
| 48 | 2,160 | Sonoma County | 42.7 | Normal | Housing Cost Burden |
| 49 | 2,222 | Orange County | 41.9 | Normal | Housing Cost Burden |
| 50 | 2,262 | Mono County | 41.4 | Normal | Employment & Wages |
| 51 | 2,280 | Contra Costa County | 41.1 | Normal | Housing Cost Burden |
| 52 | 2,405 | El Dorado County | 39.1 | Normal | Housing Cost Burden |
| 53 | 2,423 | Alameda County | 38.7 | Normal | Housing Cost Burden |
| 54 | 2,627 | Placer County | 35.5 | Normal | Housing Cost Burden |
| 55 | 2,686 | Marin County | 34.2 | Healthy | Housing Cost Burden |
| 56 | 2,914 | San Francisco County | 29.2 | Healthy | Housing Cost Burden |
| 57 | 2,963 | Santa Clara County | 27.7 | Healthy | Housing Cost Burden |
| 58 | 2,968 | San Mateo County | 27.5 | Healthy | Housing Cost Burden |
10 of 58 county reports for California are currently available. All 58 counties are scored and visible on the map above. New county reports are published weekly.
How County Scores Work
Each county is scored 0–100 using percentile-rank averaging across five data domains: Debt & Delinquency, Income & Poverty, Housing Cost Burden, Employment & Wages, and Community Vulnerability. A score of 50 means the county falls at the national median. Higher scores indicate greater financial distress.