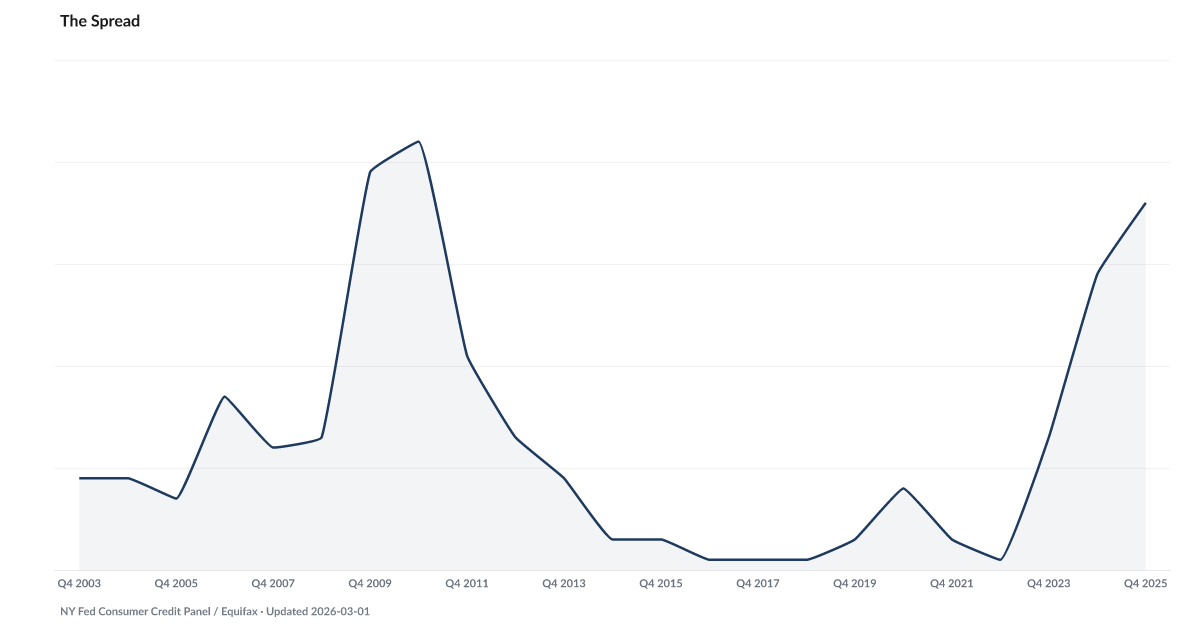
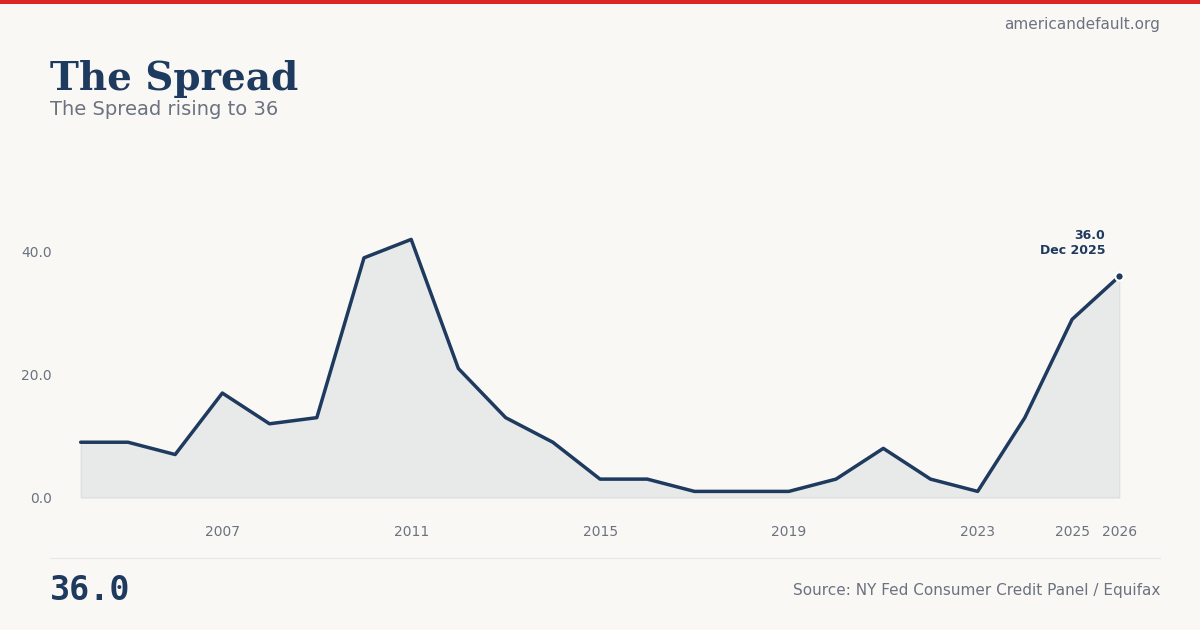
The Spread
36 — up from 29 a year ago, credit card trouble spreading geographically
What is the current The Spread?
The number of U.S. states where credit card delinquency exceeds 10% is a geographic concentration measure of household debt distress. When delinquency crosses 10% at the state level, it indicates that debt problems have spread beyond individual borrowers to affect the broader regional economy. Source: NY Fed Consumer Credit Panel.
The Spread rising to 36
Tracking worsening relative to recent baseline.
Explore Further
How has The Spread changed over time?

| Period | Value | YoY Change |
|---|---|---|
| 2025 | 36 | +7.00 |
| 2024 | 29 | +16.00 |
| 2023 | 13 | +12.00 |
| 2022 | 1 | −2.00 |
| 2021 | 3 | −5.00 |
| 2020 | 8 | +5.00 |
| 2019 | 3 | +2.00 |
| 2018 | 1 | +0.00 |
| 2017 | 1 | +0.00 |
| 2016 | 1 | −2.00 |
| 2015 | 3 | +0.00 |
| 2014 | 3 | −6.00 |
Frequently Asked Questions
How many states have credit card delinquency above 10%?
The count of states exceeding the 10% credit card delinquency threshold is tracked quarterly using New York Fed Consumer Credit Panel data. A rising count indicates that debt distress is spreading geographically rather than being concentrated in a few regions.
Why does geographic spread matter?
Concentrated distress can be managed — states and institutions can absorb localized problems. When delinquency rises above 10% in multiple states simultaneously, it indicates systemic rather than regional stress, reducing the capacity of any single policy response to address the problem.
Where does the state-level delinquency data come from?
The New York Fed's Consumer Credit Panel provides quarterly credit performance data at the state level, drawn from a nationally representative sample of Equifax credit reports.
Quick poll
Is this affecting you or your household?
Discussion
Get the numbers when they move.
New data drops, indicator updates, and ADI score changes — delivered when it matters. No spam.
or Create an Account for full access
Loading comments…