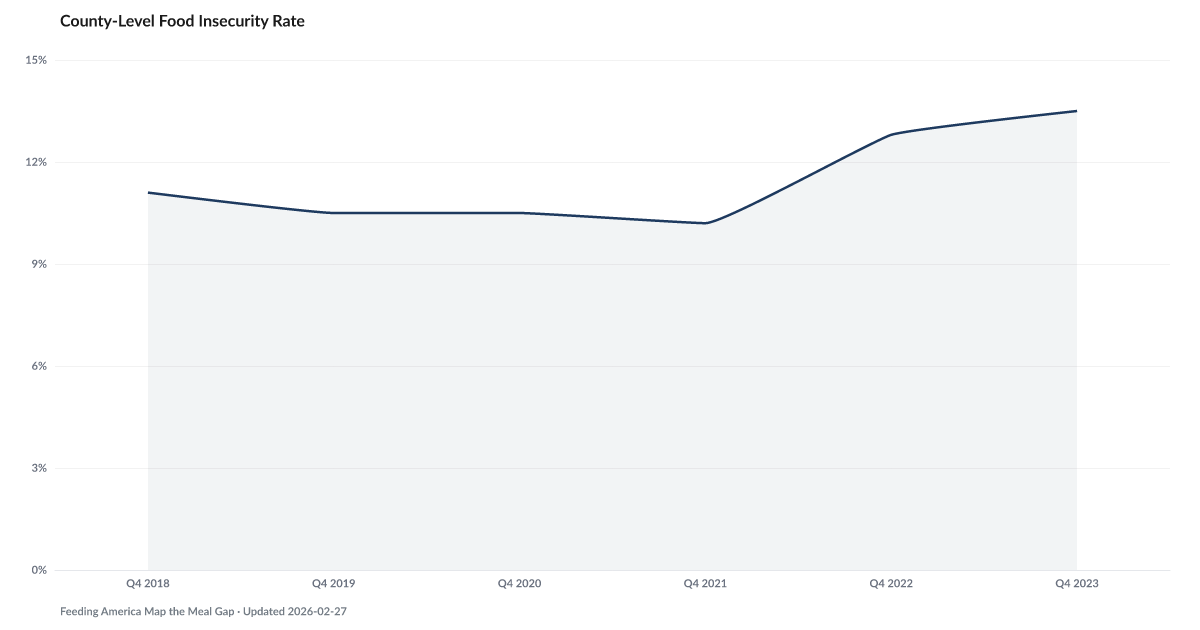
County-Level Food Insecurity Rate
13.5% — up from 12.8% a year ago, the worst reading since 2014
What is the current County-Level Food Insecurity Rate?
13.5% of Americans experience food insecurity — meaning they cannot reliably afford enough food to feed themselves and their families. Roughly 1 in 7 Americans face uncertainty about where their next meals will come from, with rates substantially higher among households with children, single-parent households, and Black and Hispanic households. Source: Feeding America / USDA.
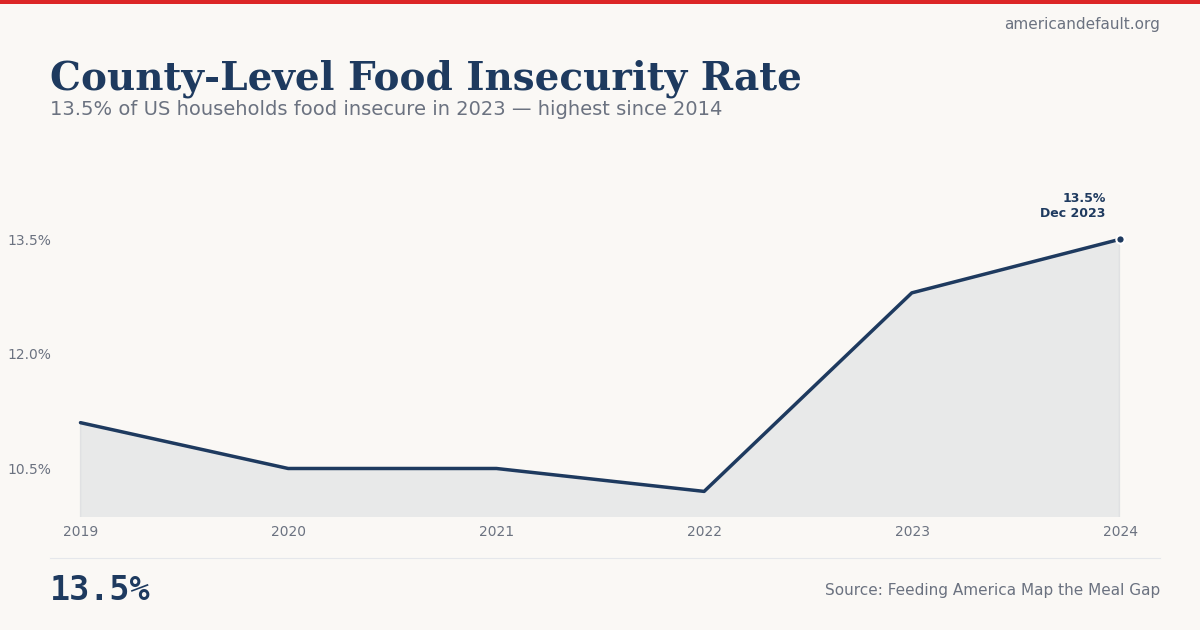
13.5% of US households food insecure in 2023 — highest since 2014
Pandemic relief held rate flat in 2020-2021. Jumped 25% after SNAP expansions expired.
Explore Further
Is this happening to you?
Have you or someone close to you used a food bank in the past year?
How has County-Level Food Insecurity Rate changed over time?

| Period | Value | YoY Change |
|---|---|---|
| 2023 | 13.5% | +0.7 pts |
| 2022 | 12.8% | +2.6 pts |
| 2021 | 10.2% | −0.3 pts |
| 2020 | 10.5% | +0.0 pts |
| 2019 | 10.5% | −0.6 pts |
| 2018 | 11.1% | — |
Frequently Asked Questions
What is the U.S. food insecurity rate?
13.5% of Americans experience food insecurity, meaning they cannot reliably access enough affordable, nutritious food. This represents approximately 1 in 7 Americans.
Who is most affected by food insecurity?
Food insecurity rates are substantially higher among households with children, single-parent households, and Black and Hispanic households. Geographic concentration is also significant, with rural areas and certain urban neighborhoods showing rates well above the national average.
Where does food insecurity data come from?
Feeding America publishes county-level food insecurity estimates based on USDA data, Census Bureau surveys, and their own modeling. The USDA's annual Household Food Security Survey provides the national benchmark.
Quick poll
Is this affecting you or your household?
Discussion
Get the numbers when they move.
New data drops, indicator updates, and ADI score changes — delivered when it matters. No spam.
or Create an Account for full access
Loading comments…