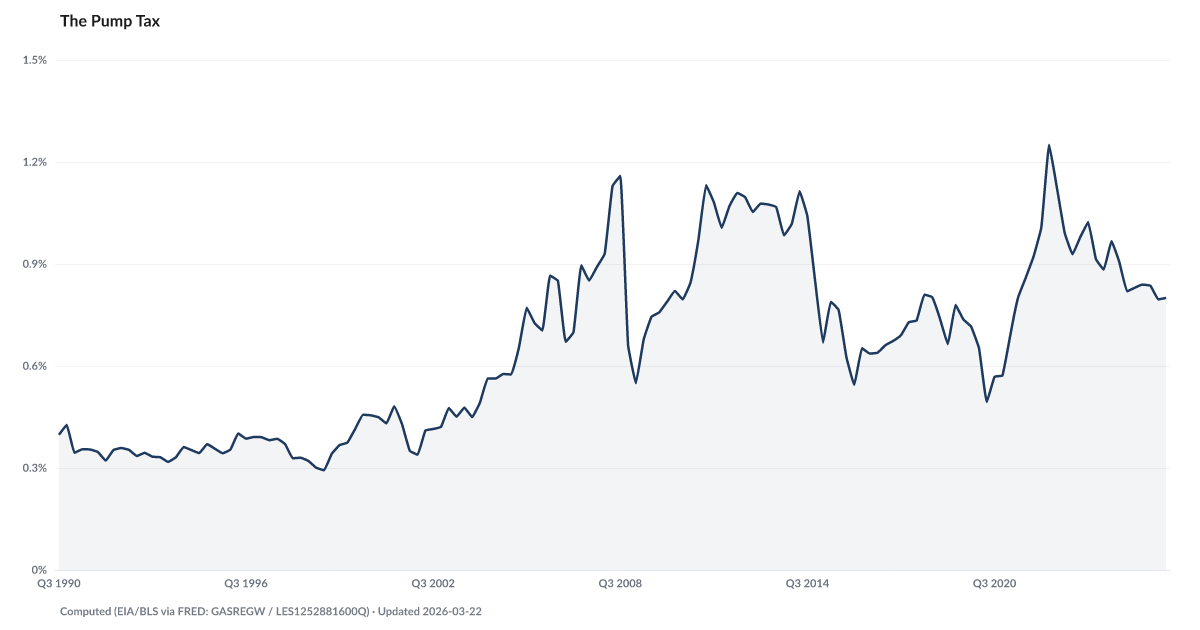
The Pump Tax
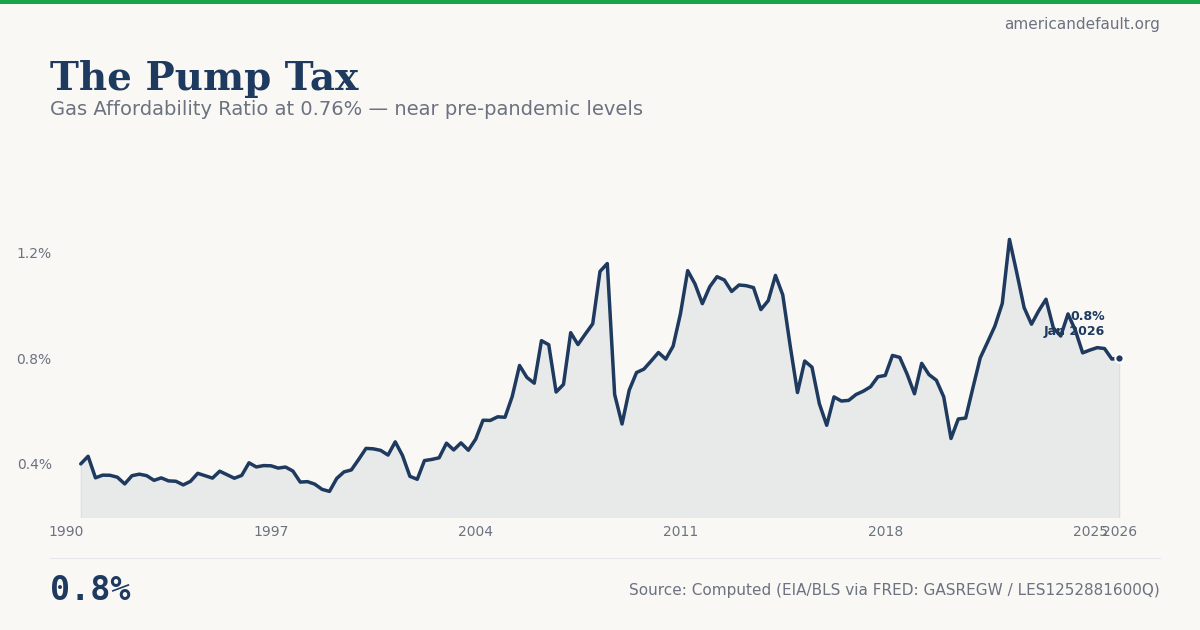
Gas costs relative to weekly earnings are retreating from the 2022 peak.
What is the current The Pump Tax?
American households are spending 0.78% of disposable income on gasoline in the latest reading. The Pump Tax tracks gasoline costs as a share of household income — a direct measure of fuel affordability. While the percentage appears small, gas spending is regressive: lower-income households spend 3-4x this share because they drive older, less efficient vehicles and live farther from work. Source: EIA, BEA.
Gas Affordability Ratio at 0.76% — near pre-pandemic levels
Gas costs relative to weekly earnings are retreating from the 2022 peak.
Explore Further
Is this happening to you?
Is filling up the tank taking a bigger bite out of your budget than it used to?
How has The Pump Tax changed over time?

| Period | Value | YoY Change |
|---|---|---|
| Q1 2026 | 0.8% | −0.0 pts |
| Q4 2025 | 0.8% | −0.0 pts |
| Q3 2025 | 0.84% | −0.1 pts |
| Q2 2025 | 0.84% | −0.1 pts |
| Q1 2025 | 0.83% | −0.1 pts |
| Q4 2024 | 0.82% | −0.1 pts |
| Q3 2024 | 0.91% | −0.1 pts |
| Q2 2024 | 0.97% | −0.0 pts |
| Q1 2024 | 0.88% | −0.0 pts |
| Q4 2023 | 0.91% | −0.1 pts |
| Q3 2023 | 1.02% | −0.1 pts |
| Q2 2023 | 0.98% | −0.3 pts |
Frequently Asked Questions
What is The Pump Tax?
The Pump Tax measures gasoline spending as a percentage of household disposable income. At 0.78%, it captures how much fuel costs burden the average American household.
Why does gas affordability matter for distress?
Gasoline is essential for commuting to work. When fuel costs spike, lower-income households — who already spend a disproportionate share on gas — must cut other spending or take on debt.
Where does this data come from?
Computed from EIA gasoline price data and BEA disposable personal income data.
Quick poll
Is this affecting you or your household?
Discussion
Get the numbers when they move.
New data drops, indicator updates, and ADI score changes — delivered when it matters. No spam.
or Create an Account for full access
Loading comments…