Mortgage Origination Volume
Quarterly dollar volume of new mortgage originations
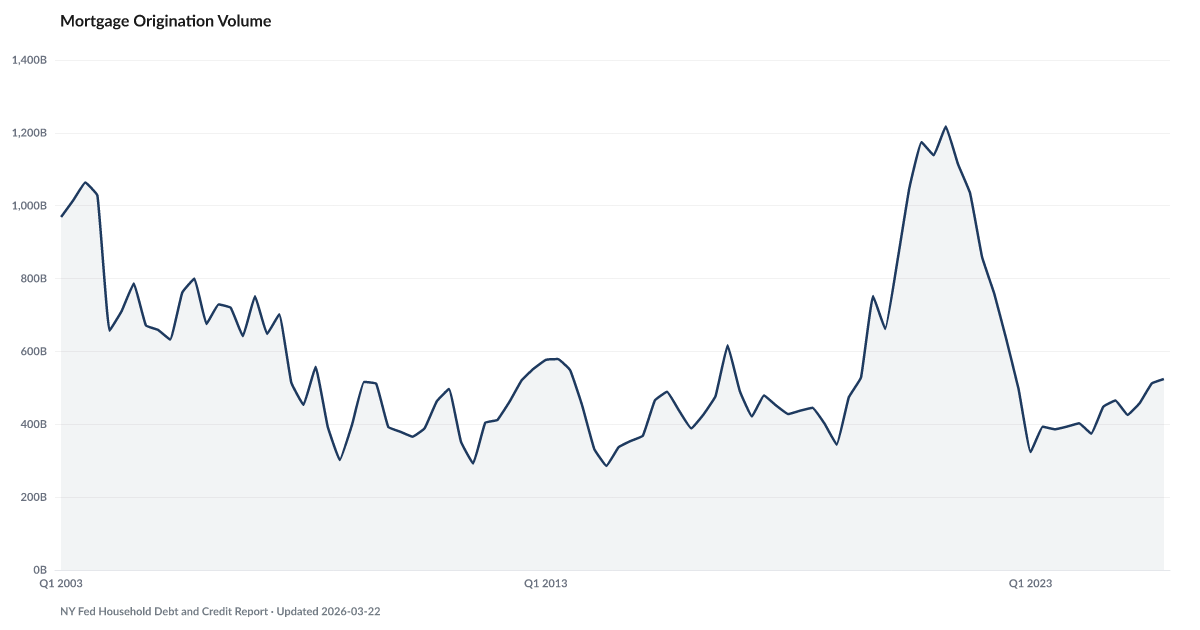
What is the current Mortgage Origination Volume?
Mortgage origination volume was $524.4B in Q4 2024, according to the NY Fed Quarterly Report on Household Debt and Credit. Origination volume reflects both demand for housing and banks' willingness to lend — declines signal tightening credit conditions. Source: NY Fed Consumer Credit Panel / Equifax.
Mortgage origination volume sits at $524.4B a quarter as of Q4 2025 but remains below 50% of the $1.2 trillion 2021 reading.
The housing market has two populations now. The people who got their mortgage before rates rose, and the people who want one.
Origination volume is the size of the second group. In Q4 2025, NY Fed data show $524.4B billion in new mortgages originated. That's up from the $323.5 billion low in early 2023, but well below the $1.2 trillion mid-2021 reading, when sub-3% rates pulled forward years of future refinancing and purchase activity into a single 18-month window.
The composition is what ages. Every quarter that origination volume runs depressed, the national mortgage book gets older, more rate-locked, and less transactional. Sellers stay in 3% homes because they can't afford 7% debt on the next one. Buyers delay. The borrowers moving in are overwhelmingly FHA and first-time, which is why First Missed has started ticking up even while overall Mortgage Delinquency stays near pre-pandemic levels.
Low origination volume also blinds parts of the data. Delinquency rates are computed against the existing book. A book full of vintage 2020-2021 paper at 3% is structurally safer than a book full of 2024-2025 paper at 7%. The calm in 90-day mortgage delinquency is partly the calm of a book that mostly predates this rate environment.
Explore Further
Is this happening to you?
Have high rates made buying or refinancing feel impossible?
How has Mortgage Origination Volume changed over time?

Most affected counties
Counties with the highest delinquency scores in the County Distress Index.
Explore all 3,144 counties →| Period | Value | YoY Change |
|---|---|---|
| Q4 2025 | $524.4B | +$59.1B |
| Q3 2025 | $512.2B | +$63.8B |
| Q2 2025 | $458.3B | +$84.2B |
| Q1 2025 | $425.6B | +$23.0B |
| Q4 2024 | $465.3B | +$71.6B |
| Q3 2024 | $448.3B | +$61.9B |
| Q2 2024 | $374.1B | −$19.3B |
| Q1 2024 | $402.7B | +$79.1B |
| Q4 2023 | $393.8B | −$103.8B |
| Q3 2023 | $386.4B | −$246.1B |
| Q2 2023 | $393.4B | −$364.8B |
| Q1 2023 | $323.5B | −$535.4B |
Frequently Asked Questions
What is current mortgage origination volume?
U.S. mortgage originations totaled $524.4B in Q4 2024. This includes new purchases, refinances, and home equity originations.
Why does mortgage origination volume matter?
Falling origination volume signals tightening credit conditions and reduced housing demand. The American Distress Index tracks it as a financial conditions indicator.
Where does this data come from?
This data comes from the NY Fed Consumer Credit Panel, published quarterly as part of the Quarterly Report on Household Debt and Credit.

Quick poll
Is this affecting you or your household?
Discussion
Get the numbers when they move.
New data drops, indicator updates, and ADI score changes — delivered when it matters. No spam.
or Create an Account for full access
Loading comments…