Mortgage Debt Service Ratio
Mortgage payments as share of household income
What is the current Mortgage Debt Service Ratio?
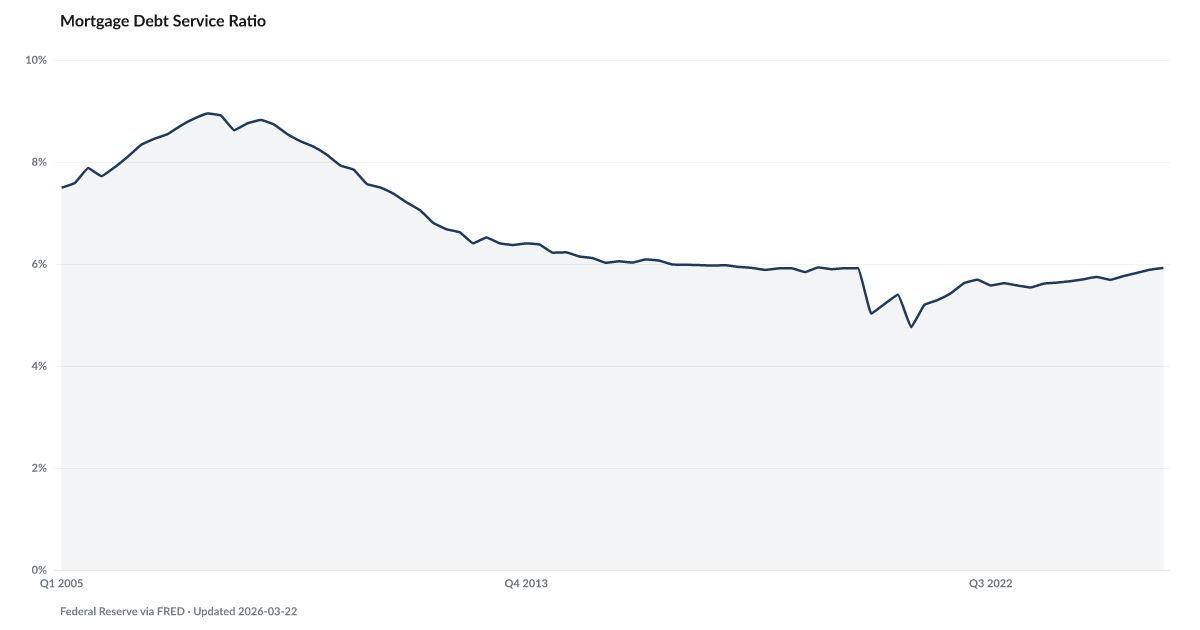
The mortgage debt service ratio isolates the share of household income consumed specifically by mortgage payments. This measure helps distinguish between mortgage-related stress and non-housing debt stress, which have moved in different directions in the current cycle. Source: Federal Reserve via FRED.
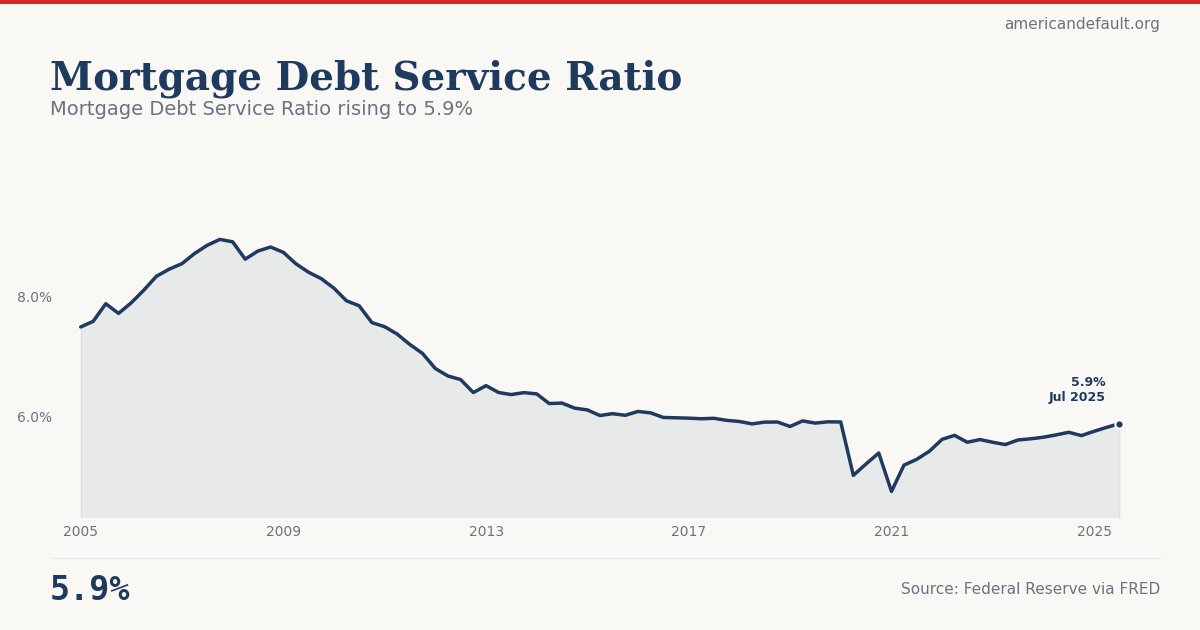
Mortgage Debt Service Ratio rising to 5.9%
Tracking worsening relative to recent baseline.
Explore Further
How has Mortgage Debt Service Ratio changed over time?

| Period | Value | YoY Change |
|---|---|---|
| Q4 2025 | 5.92% | +0.2 pts |
| Q3 2025 | 5.89% | +0.1 pts |
| Q2 2025 | 5.83% | +0.1 pts |
| Q1 2025 | 5.76% | +0.1 pts |
| Q4 2024 | 5.69% | +0.1 pts |
| Q3 2024 | 5.74% | +0.1 pts |
| Q2 2024 | 5.7% | +0.2 pts |
| Q1 2024 | 5.66% | +0.1 pts |
| Q4 2023 | 5.64% | +0.0 pts |
| Q3 2023 | 5.62% | +0.0 pts |
| Q2 2023 | 5.54% | −0.2 pts |
| Q1 2023 | 5.58% | −0.0 pts |
Frequently Asked Questions
What is the mortgage debt service ratio?
It measures mortgage payments as a percentage of household disposable personal income. In the current cycle, mortgage debt service has remained relatively contained because many homeowners locked in historically low rates during 2020–2021.
Why track mortgage debt service separately?
Mortgage and non-housing debt service have diverged in the current cycle. Low locked-in mortgage rates have kept mortgage debt service in check, while credit card and auto loan costs have surged. Tracking them separately reveals where the pressure actually is.
Where does this data come from?
The Federal Reserve publishes the mortgage debt service ratio quarterly as a component of the broader household debt service ratio. Available on FRED.
Quick poll
Is this affecting you or your household?
Discussion
Get the numbers when they move.
New data drops, indicator updates, and ADI score changes — delivered when it matters. No spam.
or Create an Account for full access
Loading comments…