Medicaid / CHIP Enrollment (Monthly)
Down from 79M; unwinding pushing people off rolls, not into coverage
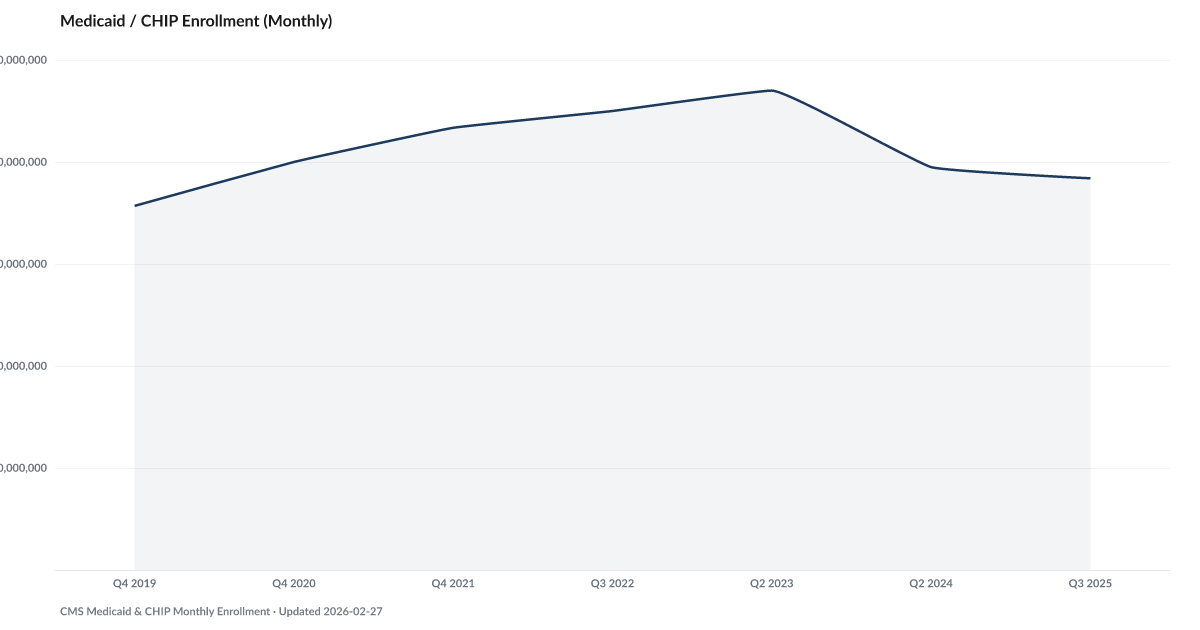
What is the current Medicaid / CHIP Enrollment (Monthly)?
Medicaid / CHIP Enrollment (Monthly): 76,800,000 as of 2025-09, and improving. Source: CMS Medicaid & CHIP Monthly Enrollment.
Medicaid and CHIP enrollment has moved down from its all-time high of 94,000,000 in April 2023; current 76,800,000 has not exceeded that peak. It remains above the pre-pandemic baseline after the largest public-insurance unwinding in U.S. history.
The Centers for Medicare and Medicaid Services publish monthly enrollment data for Medicaid and the Children's Health Insurance Program. Enrollment ballooned to 94 million in April 2023 under pandemic-era continuous coverage rules, which prevented states from dropping anyone from the rolls regardless of income changes. Once that protection ended, the unwinding began.
Millions of people have come off the rolls since then, but enrollment still sits above the October 2019 baseline of 71.4 million — meaning the pool of people who qualify for public health coverage because they cannot afford private insurance has grown across the cycle, not shrunk.
Research from KFF and Urban Institute has found that a majority of those disenrolled lost coverage for procedural reasons — missed paperwork, renewal notices sent to outdated addresses — rather than because their income rose above eligibility limits. Many of those people are likely still eligible and now uninsured.
Medical costs are the number-one cited cause of bankruptcy filings in the United States. A coverage loss today flows into medical debt tomorrow and Phantom Debt, Falling Behind, and eventually Bankruptcy Filings further out. The disenrolled population is the leading edge of a stress wave the composite will pick up over the next several quarters.
Explore Further
How has Medicaid / CHIP Enrollment (Monthly) changed over time?

Most affected counties
Counties with the highest safety net and buffer scores in the County Distress Index.
Explore all 3,144 counties →| Period | Value | YoY Change |
|---|---|---|
| 2025 | 76,800,000 | — |
| 2024 | 79,000,000 | — |
| 2023 | 94,000,000 | — |
| 2022 | 90,000,000 | — |
| 2021 | 86,700,000 | +6700000.00 |
| 2020 | 80,000,000 | — |
| 2019 | 71,400,000 | — |
Frequently Asked Questions
What is Medicaid / CHIP Enrollment (Monthly)?
Down from 79M; unwinding pushing people off rolls, not into coverage
Why does Medicaid / CHIP Enrollment (Monthly) matter for financial distress?
Medicaid / CHIP Enrollment (Monthly) is one of the indicators tracked by the American Distress Index (ADI), which measures five dimensions of U.S. household financial distress: Delinquency, Default & Legal, Debt Burden, Labor, and Safety Net & Buffer. Changes in this indicator contribute to the overall distress picture.
Where does the Medicaid / CHIP Enrollment (Monthly) data come from?
This data comes from CMS Medicaid & CHIP Monthly Enrollment. More information: https://data.medicaid.gov/. The American Distress Index updates this indicator annual.

Quick poll
Is this affecting you or your household?
Discussion
Get the numbers when they move.
New data drops, indicator updates, and ADI score changes — delivered when it matters. No spam.
or Create an Account for full access
Loading comments…