Bankruptcy Filings
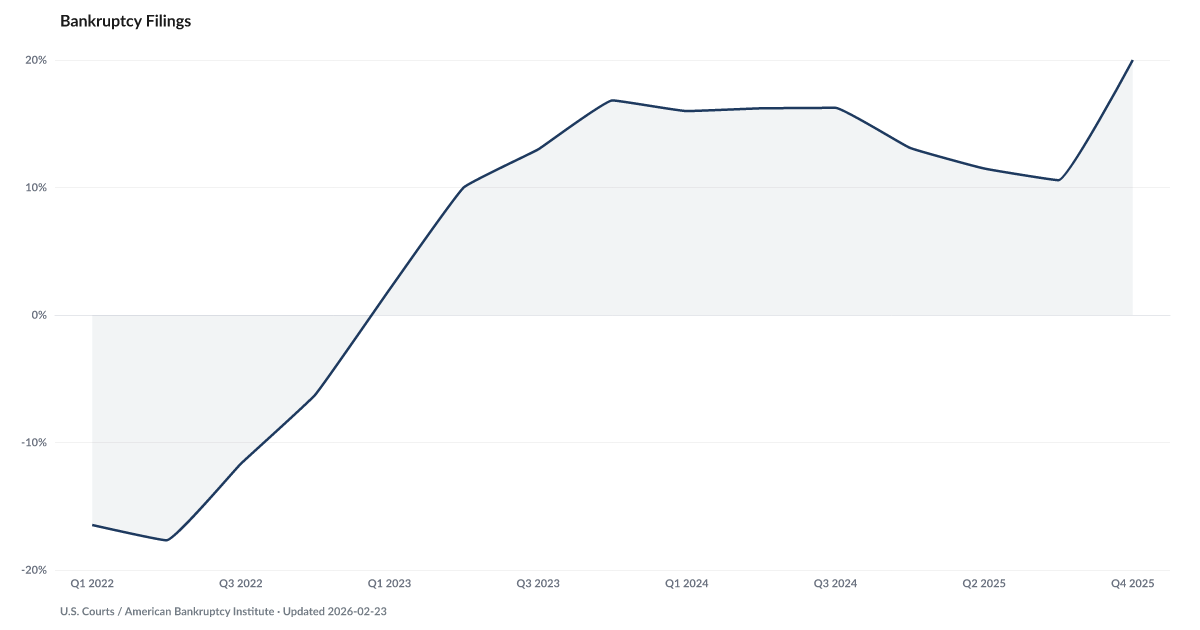
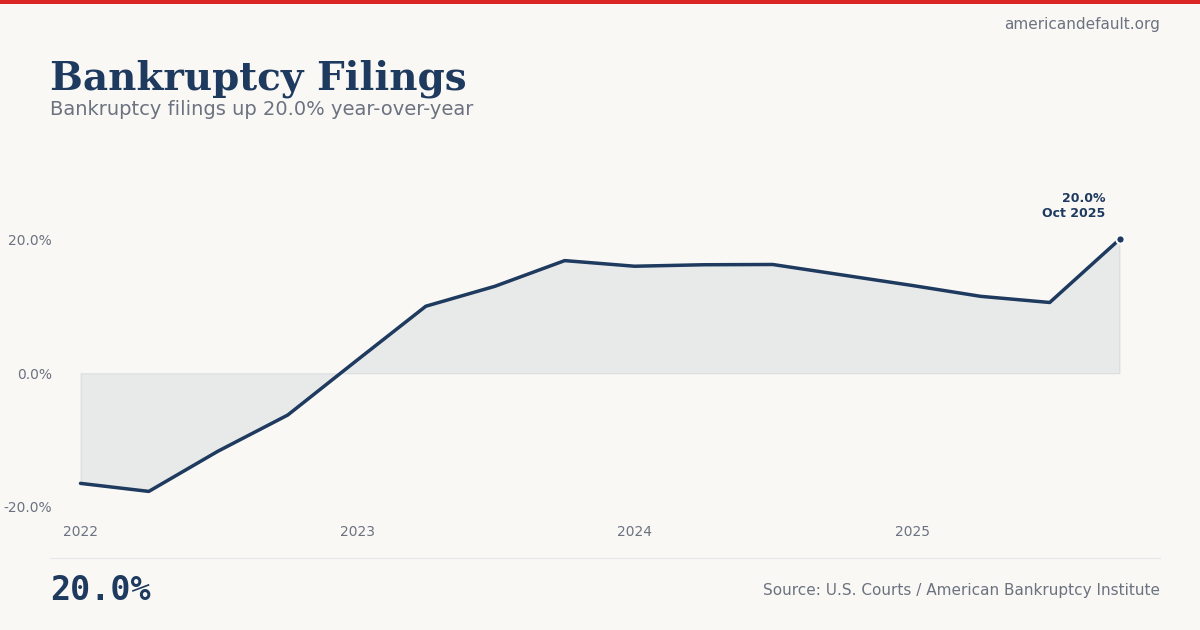
20.0% — up from 10.6% a quarter ago; a sustained climb, not a spike
What is the current Bankruptcy Filings?
Total consumer bankruptcy filings rose 20% year-over-year in Q4 2025, according to U.S. Courts data — the sharpest quarterly increase in the current cycle and a continuation of a trend that began in early 2023. Unlike the post-moratorium normalization of 2022, the current increases are building on an already-rising baseline. The Chapter 7-to-Chapter 13 ratio has climbed to 1.72, meaning nearly two families choose total liquidation for every one that attempts reorganization. Source: U.S. Courts (Q4 2025).
Bankruptcy filings have risen year-over-year for every quarter since early 2023 — the longest sustained increase since the aftermath of the Great Recession.
Total bankruptcy filings rose 20% year-over-year in Q4 2025, according to U.S. Courts data — the sharpest quarterly increase in the current cycle and a continuation of a trend that began in early 2023. Unlike the post-moratorium spikes of 2022, which reflected normalization from artificially suppressed levels, the current increases are building on an already-rising baseline.
The composition of these filings tells a story that the headline number alone cannot. The Wipeout Ratio shows the Chapter 7-to-Chapter 13 ratio climbing to 1.72 — meaning for every family attempting to reorganize their debts, nearly two are choosing total liquidation. Chapter 7 means walking away from everything except exempt assets. It's the option people choose when the math simply doesn't work anymore.
Bankruptcy is the terminal event in the distress pipeline. It begins with depleted savings (The Buffer at 3.6%), moves through missed payments (Falling Behind at 4.8%), and may pass through Foreclosure Filings before arriving at the courthouse. The 20% increase represents families who ran out of alternatives months or years ago.
Explore Further
Is this happening to you?
Do you feel like your debts have grown beyond what you can realistically pay back?
How has Bankruptcy Filings changed over time?

| Period | Value | YoY Change |
|---|---|---|
| Q4 2025 | 20% | — |
| Q3 2025 | 10.57% | −5.7 pts |
| Q2 2025 | 11.49% | −4.7 pts |
| Q1 2025 | 13.11% | −2.9 pts |
| Q3 2024 | 16.25% | +3.3 pts |
| Q2 2024 | 16.21% | +6.2 pts |
| Q1 2024 | 15.99% | +14.0 pts |
| Q4 2023 | 16.83% | +23.1 pts |
| Q3 2023 | 12.99% | +24.7 pts |
| Q2 2023 | 10.01% | +27.7 pts |
| Q1 2023 | 2% | +18.5 pts |
| Q4 2022 | -6.26% | — |
Frequently Asked Questions
How much have bankruptcy filings increased?
Total consumer bankruptcy filings rose 20% year-over-year in Q4 2025, according to U.S. Courts data. Filings have risen year-over-year every quarter since early 2023, the longest sustained increase since the aftermath of the Great Recession.
Are people choosing Chapter 7 or Chapter 13 bankruptcy?
Increasingly Chapter 7. The Chapter 7-to-Chapter 13 filing ratio rose to 1.72 in 2025. In Chapter 7, filers surrender non-exempt assets and discharge debts entirely. A rising ratio toward Chapter 7 indicates that filers' income can no longer cover even a reduced repayment schedule.
What drives people to file bankruptcy?
Bankruptcy is the terminal event in the distress pipeline. It typically follows depleted savings (personal savings rate at 3.6%), missed payments (total delinquency at 4.8%), and potentially foreclosure. The 20% increase represents families who ran out of alternatives months or years before filing.
How do current filings compare to historical levels?
Current filing levels are building on a rising baseline but remain below the peaks seen during the 2008-2010 crisis. However, the sustained upward trend — every quarter rising since early 2023 — and the shift toward Chapter 7 liquidation signal worsening underlying conditions.
Where does bankruptcy filing data come from?
U.S. Courts publishes bankruptcy filing statistics quarterly, broken down by chapter and judicial district. American Default tracks year-over-year changes in total filings and the Chapter 7-to-Chapter 13 ratio as indicators of household financial distress severity.
Quick poll
Is this affecting you or your household?
Discussion
Get the numbers when they move.
New data drops, indicator updates, and ADI score changes — delivered when it matters. No spam.
or Create an Account for full access
Loading comments…