Falling Behind
Total loan delinquency across all consumer debt types
What is the current Falling Behind?
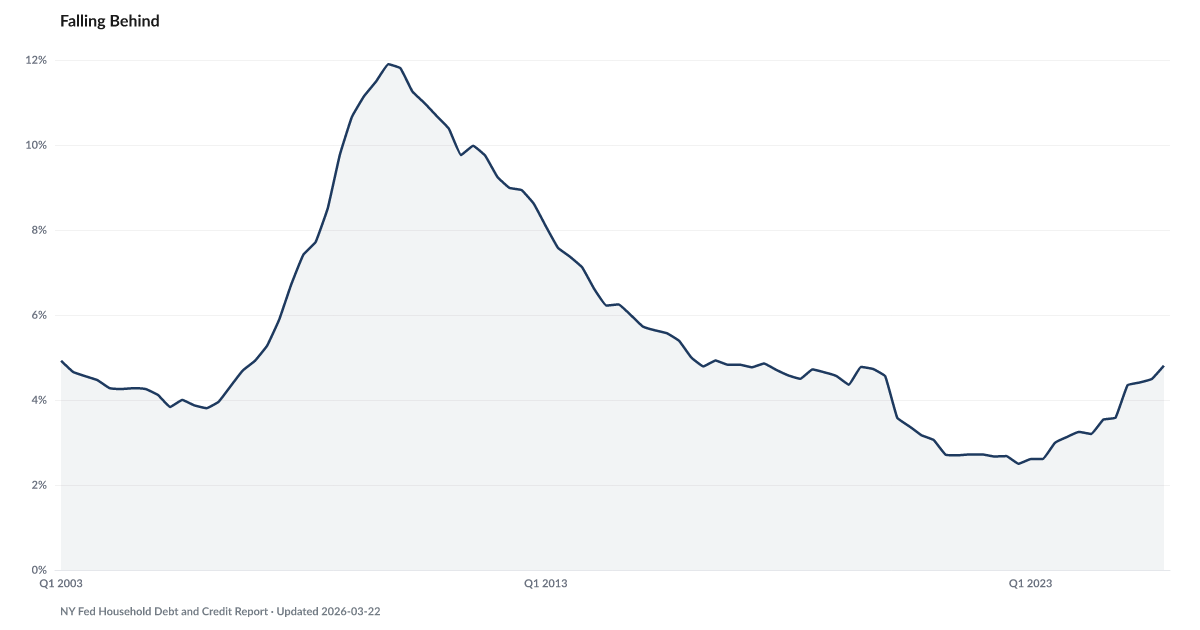
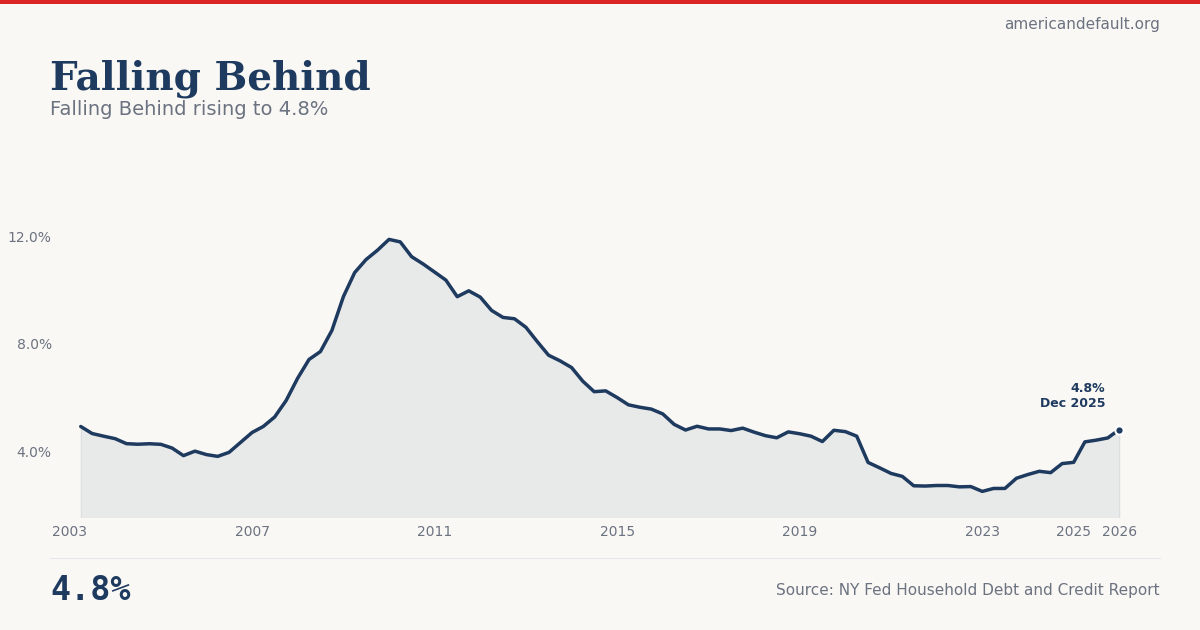
The total delinquency rate across all consumer loan balances reached 4.8% in Q4 2025, according to the New York Fed's Household Debt and Credit Report — the highest since 2020 and a steady climb from the 2.5% pandemic-era low in Q4 2022. The pandemic relief suppression of delinquency is now fully unwound, with stress concentrated among FHA borrowers (11.52%), auto loans (5.2% serious delinquency), and small bank credit card borrowers (6.62%). Source: NY Fed Household Debt and Credit Report (Q4 2025).
The broadest measure of how Americans are managing their debt has climbed steadily for three years, returning to pre-pandemic levels.
The total delinquency rate across all consumer loan balances reached 4.8% in Q4 2025, according to the New York Fed's Household Debt and Credit Report. This is the highest level since 2020 and marks a steady climb from the 2.5% pandemic-era low in Q4 2022. The pandemic relief programs — forbearance, stimulus checks, enhanced unemployment — temporarily suppressed delinquency to historically low levels. That suppression is fully unwound.
The stress is not uniform across loan types. The FHA Signal shows FHA mortgage delinquency at 11.52%, while conventional mortgages remain at 2.89% — a widening gap that reveals which borrowers are under the most pressure. The Repo Line shows auto loan serious delinquency at 5.2%, the highest since the aftermath of the 2008 financial crisis.
What's distinct about the current deterioration is that it's happening during a period of relatively low unemployment. In previous cycles, delinquency rose sharply during recessions when job losses cut household income. This time, the pressure is coming from the cost side: The Other Banks shows small bank credit card delinquency at 6.62%, more than double the rate at the largest banks, suggesting that borrowers outside the prime credit ecosystem are absorbing the brunt of higher rates and depleted savings.
Explore Further
Is this happening to you?
Have you missed a payment or fallen behind on any bill in the past year?
How has Falling Behind changed over time?

| Period | Value | YoY Change |
|---|---|---|
| Q4 2025 | 4.81% | +1.2 pts |
| Q3 2025 | 4.49% | +1.0 pts |
| Q2 2025 | 4.41% | +1.2 pts |
| Q1 2025 | 4.35% | +1.1 pts |
| Q4 2024 | 3.58% | +0.5 pts |
| Q3 2024 | 3.54% | +0.5 pts |
| Q2 2024 | 3.2% | +0.6 pts |
| Q1 2024 | 3.25% | +0.6 pts |
| Q4 2023 | 3.13% | +0.6 pts |
| Q3 2023 | 2.99% | +0.3 pts |
| Q2 2023 | 2.61% | −0.1 pts |
| Q1 2023 | 2.61% | −0.1 pts |
Frequently Asked Questions
What is the current U.S. loan delinquency rate?
The total delinquency rate across all consumer loan balances was 4.8% in Q4 2025, according to the New York Fed. This includes mortgages, credit cards, auto loans, and student loans combined. It is the highest level since 2020.
Which types of loans have the highest delinquency?
FHA mortgages show the highest delinquency at 11.52%, followed by small bank credit cards at 6.62% and auto loans at 5.2% serious delinquency (90+ days past due). Conventional mortgage delinquency remains relatively low at 2.89%. The stress is concentrated among borrowers with thinner financial cushions.
Is delinquency rising because of unemployment?
No. What is distinct about the current deterioration is that it is happening during a period of relatively low unemployment. In previous cycles, delinquency rose sharply during recessions when job losses cut income. This time, the pressure comes from the cost side — record credit card interest rates, depleted savings, and essential costs outpacing wage growth for lower-income households.
How does current delinquency compare to the 2008 crisis?
The current 4.8% total delinquency rate is well below the crisis peak levels of 2008–2010. However, the rate has been climbing steadily for three years from a pandemic-era floor, and the direction of the trend — rather than the absolute level — is what the American Distress Index monitors as a warning signal.
Where does the total delinquency data come from?
The New York Fed publishes total delinquency data quarterly in its Household Debt and Credit Report, based on a nationally representative sample from Equifax consumer credit reports covering approximately 5% of U.S. consumers with credit files.
Quick poll
Is this affecting you or your household?
Discussion
Get the numbers when they move.
New data drops, indicator updates, and ADI score changes — delivered when it matters. No spam.
or Create an Account for full access
Loading comments…