The Buffer
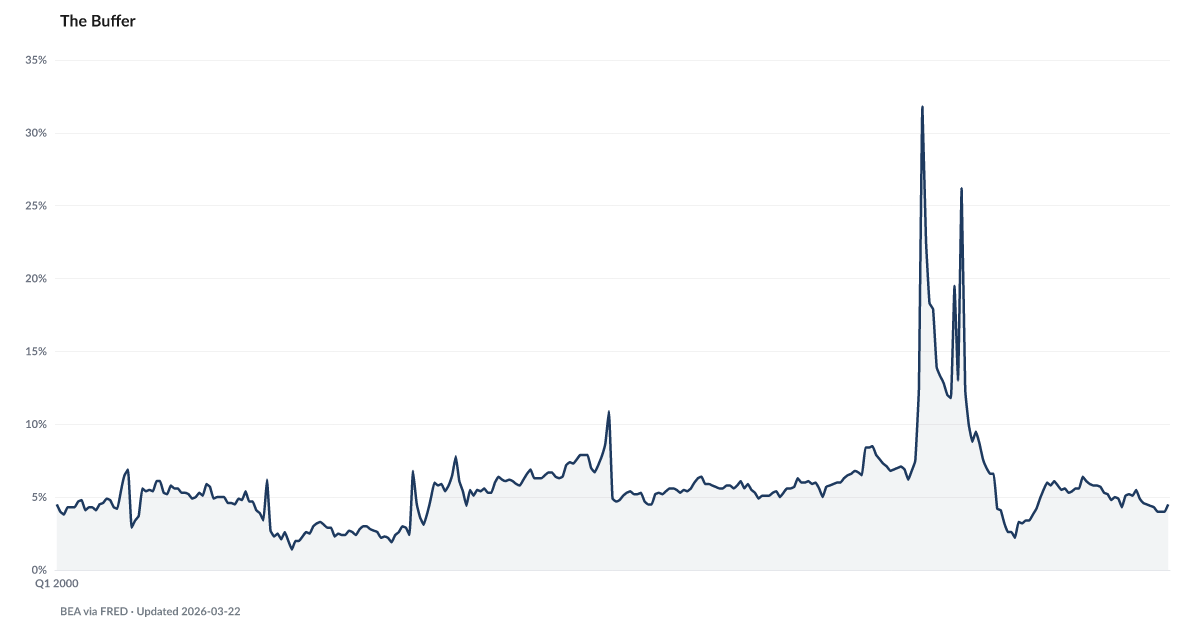
Personal savings rate as share of disposable income
What is the current The Buffer?
The U.S. personal savings rate fell to 3.6% of disposable income in December 2025, down from 4.3% a year earlier, according to the Bureau of Economic Analysis. This is roughly half the 7.5% pre-pandemic average and well below the 5–7% range economists consider a healthy buffer against financial shocks. The American Distress Index weights this indicator at 30% — the largest share of any component — based on validated research showing that savings rate declines precede loan delinquency spikes by approximately 9 quarters. Source: BEA via FRED (PSAVERT).
The national savings rate has fallen to a level that historically precedes significant increases in loan delinquency.
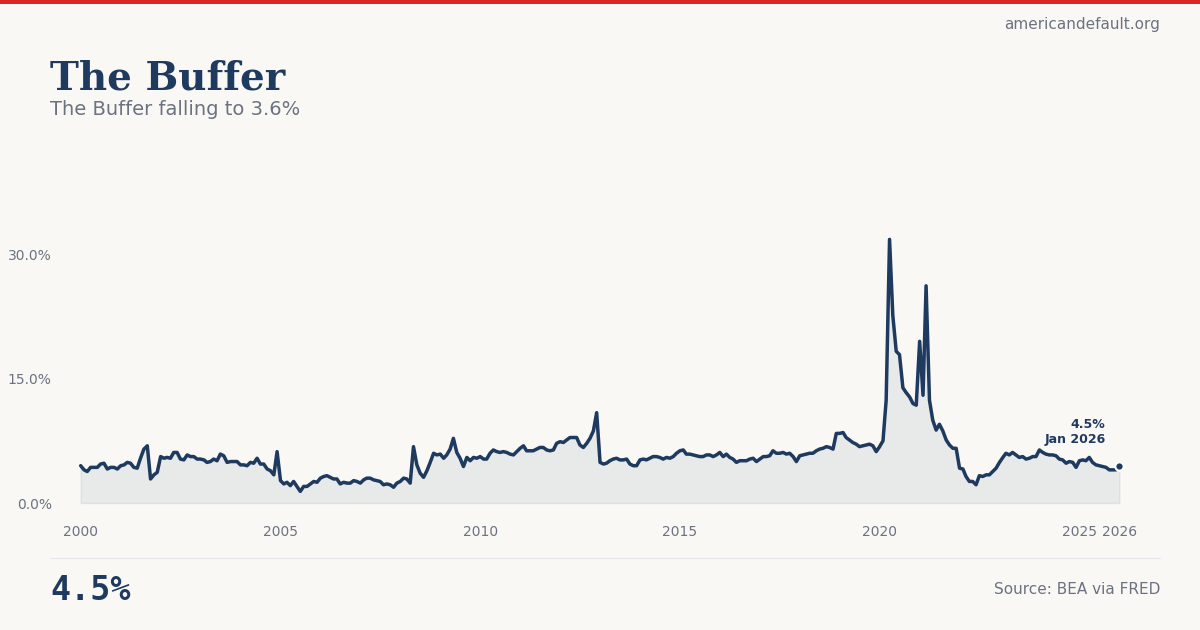
Americans saved just 3.6% of disposable personal income in December 2025, according to the Bureau of Economic Analysis — roughly half the 7.5% pre-pandemic average and well below the 5–7% range economists consider healthy. The decline has been steady: from 5.2% at the start of 2025, to 4.0% by September, to 3.6% by year's end. Pandemic-era excess savings are fully exhausted.
When the savings rate drops this low, the effects cascade through every measure of household financial health. The Safety Net shows just 41% of Americans could handle a $1,000 emergency from savings — the weakest reading in a decade. The Cannibalization Rate reveals that 4.8% of 401(k) participants are taking hardship withdrawals, more than double pre-pandemic levels. The macro savings rate and the micro household surveys are telling the same story.
Historically, this is a leading indicator. During the 2005–2007 period, the savings rate fell below 3% — over two years before mortgage delinquencies spiked in the financial crisis. Debt Service shows household debt payments now consuming 11.3% of disposable income and climbing. With savings depleted and debt service rising, the margin for error has all but disappeared.
Explore Further
Is this happening to you?
How many months of expenses could you cover if your income stopped tomorrow?
How has The Buffer changed over time?

| Period | Value | YoY Change |
|---|---|---|
| Jan 2026 | 4.5% | −0.6 pts |
| Dec 2025 | 4% | −0.3 pts |
| Nov 2025 | 4% | −0.9 pts |
| Oct 2025 | 4% | −1.0 pts |
| Sep 2025 | 4.3% | −0.5 pts |
| Aug 2025 | 4.4% | −0.8 pts |
| Jul 2025 | 4.5% | −0.8 pts |
| Jun 2025 | 4.6% | −1.1 pts |
| May 2025 | 4.9% | −0.9 pts |
| Apr 2025 | 5.5% | −0.3 pts |
| Mar 2025 | 5.1% | −0.8 pts |
| Feb 2025 | 5.2% | −0.9 pts |
Frequently Asked Questions
What is the current U.S. personal savings rate?
The U.S. personal savings rate was 3.6% of disposable income in December 2025, according to the Bureau of Economic Analysis. This is down from 4.3% in December 2024 and roughly half the 7.5% pre-pandemic average.
Why does the personal savings rate matter for financial distress?
The personal savings rate is a leading indicator of household financial distress. American Distress Index analysis shows that declines in the savings rate (Buffer Depletion) precede increases in loan delinquency (Debt Stress) by approximately 9 quarters, with a cross-correlation of r=0.69. When savings fall below 5%, households lose the cushion that prevents missed payments from cascading into default.
What is a healthy personal savings rate?
Economists generally consider a personal savings rate of 5–7% of disposable income to be a healthy baseline. The pre-pandemic (2015–2019) average was approximately 7.5%. Rates below 4% have historically been associated with elevated household financial vulnerability and preceded the 2008 financial crisis.
How is the personal savings rate used in the American Distress Index?
The personal savings rate is a component of the Buffer Depletion dimension, which receives the largest weight (30%) in the American Distress Index. This weighting is based on the validated finding that Buffer Depletion leads Debt Stress by 9 quarters. The savings rate is converted to a Z-score against a 2015–2024 baseline and combined with the household debt service ratio.
Where does the personal savings rate data come from?
The personal savings rate is published monthly by the Bureau of Economic Analysis (BEA) as part of the Personal Income and Outlays report. American Default tracks it via the FRED series PSAVERT. Data is typically released with a one-month lag.
Quick poll
Is this affecting you or your household?
Discussion
Get the numbers when they move.
New data drops, indicator updates, and ADI score changes — delivered when it matters. No spam.
or Create an Account for full access
Loading comments…