Debt Service
Share of household income consumed by debt payments
What is the current Debt Service?
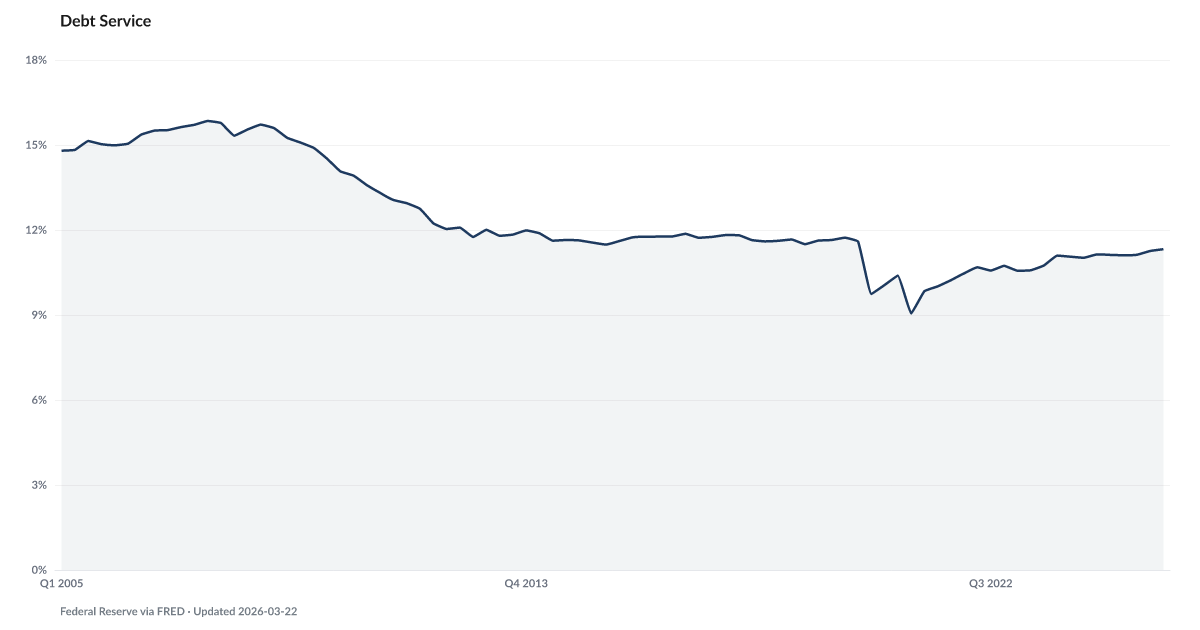
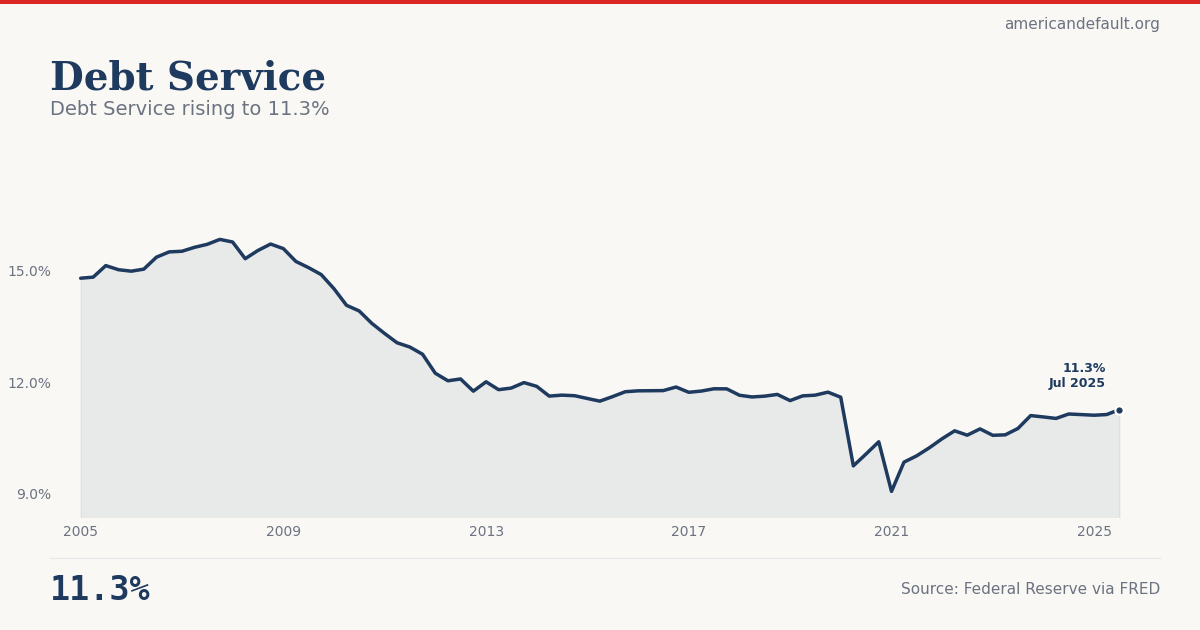
Household debt service payments consumed 11.3% of disposable personal income in Q3 2025, according to Federal Reserve data — up from a pandemic-era low of 9.1% in Q1 2021. The climb has been steady for over four years, driven by higher interest rates across mortgages, auto loans, and credit cards. While still below the 15.8% peak before the 2008 crisis, the direction has been consistently upward. Source: Federal Reserve via FRED (TDSP).
The share of household income consumed by debt payments has climbed back to pre-pandemic levels, squeezing the same paychecks that are already losing ground to inflation.
Household debt service payments consumed 11.3% of disposable personal income in Q3 2025, according to Federal Reserve data — up from a pandemic-era low of 9.1% in Q1 2021. The climb has been steady and persistent, driven by higher interest rates across mortgages, auto loans, and credit cards. While the current level remains below the 15.8% peak reached before the 2008 financial crisis, the direction of travel has been consistently upward for over four years.
What's changed since the pre-GFC era is the composition. Mortgage rates are lower, keeping that component in check. The pressure is coming from non-housing debt, particularly credit cards. The Card Tax shows the average credit card APR at a record 20.97%, meaning each dollar of revolving debt costs more to service than at any point in history. The Buffer shows the savings rate at 3.6% — meaning less of each paycheck is available to cover the rising cost of debt.
The debt service ratio is one of the ADI's composite components for a reason: it captures the intersection of debt levels, interest rates, and income growth in a single number. When it rises during a period of employment stability, it signals that the cost of living and the cost of borrowing are outpacing income gains. The Repo Line shows auto loan delinquency at 5.2%, the highest since 2010, suggesting that for some households, the debt service burden has already become unmanageable.
Explore Further
Is this happening to you?
What share of your monthly income goes to debt payments?
How has Debt Service changed over time?

| Period | Value | YoY Change |
|---|---|---|
| Q4 2025 | 11.32% | +0.2 pts |
| Q3 2025 | 11.26% | +0.1 pts |
| Q2 2025 | 11.12% | +0.1 pts |
| Q1 2025 | 11.11% | +0.0 pts |
| Q4 2024 | 11.12% | +0.0 pts |
| Q3 2024 | 11.14% | +0.4 pts |
| Q2 2024 | 11.02% | +0.4 pts |
| Q1 2024 | 11.06% | +0.5 pts |
| Q4 2023 | 11.1% | +0.4 pts |
| Q3 2023 | 10.75% | +0.2 pts |
| Q2 2023 | 10.58% | −0.1 pts |
| Q1 2023 | 10.56% | +0.1 pts |
Frequently Asked Questions
What share of income goes to debt payments in the U.S.?
U.S. households spent 11.3% of disposable personal income on debt service payments in Q3 2025, according to Federal Reserve data. This includes mortgage payments, credit card minimum payments, auto loan payments, and student loan payments.
Is the debt service ratio rising or falling?
Rising. The ratio has climbed steadily from a pandemic-era low of 9.1% in Q1 2021 to 11.3% in Q3 2025. The increase is driven primarily by higher interest rates — particularly credit card APRs at a record 20.97% — rather than by a surge in new borrowing.
How does the current debt service ratio compare to the 2008 crisis?
The current 11.3% is below the 15.8% peak reached before the 2008 financial crisis. However, the composition has shifted: mortgage debt service is lower due to historically low rates locked in during 2020–2021, while non-housing debt service (credit cards, auto loans) has increased significantly.
Why does the debt service ratio matter?
The debt service ratio captures the intersection of debt levels, interest rates, and income growth in a single number. When it rises during a period of employment stability, it signals that borrowing costs and living expenses are outpacing wage gains. It is a component of the American Distress Index's Buffer Depletion dimension.
Where does the debt service data come from?
The Federal Reserve publishes the household debt service ratio quarterly as FRED series TDSP. It is calculated as an estimate of total required household debt payments divided by disposable personal income. The data is released with approximately a two-quarter lag.
Quick poll
Is this affecting you or your household?
Discussion
Get the numbers when they move.
New data drops, indicator updates, and ADI score changes — delivered when it matters. No spam.
or Create an Account for full access
Loading comments…