Annual Homelessness Assessment (PIT Count)
Up from 653,104 a year ago; roughly the population of Seattle
What is the current Annual Homelessness Assessment (PIT Count)?
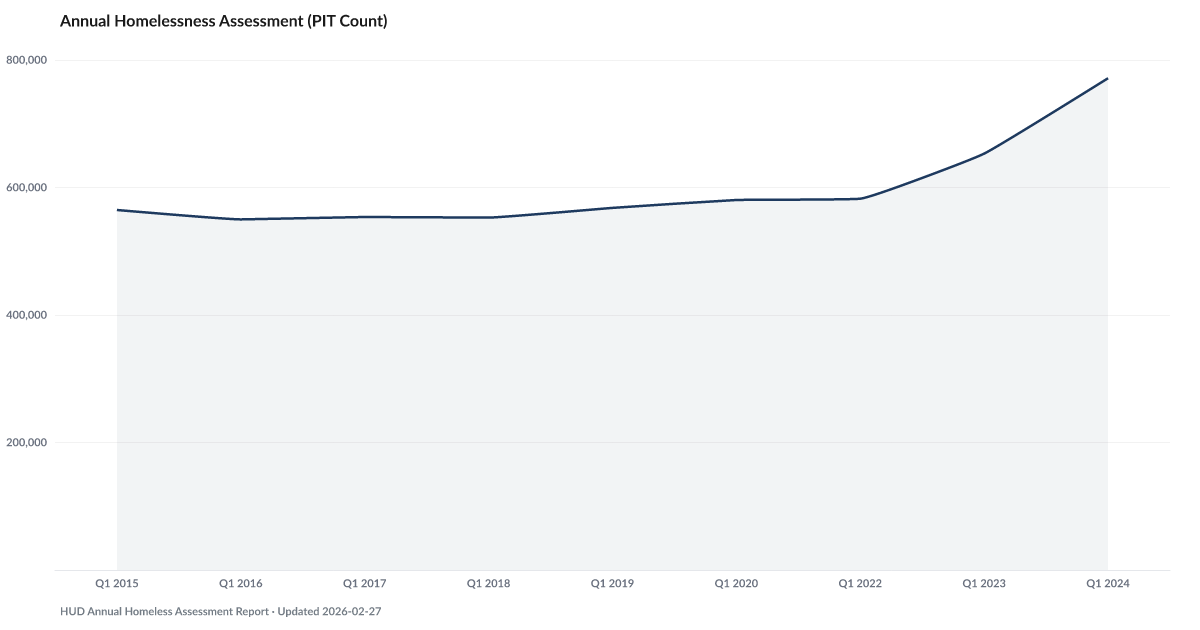
Annual Homelessness Assessment (PIT Count): 771,480 as of 2024, and worsening. Source: HUD Annual Homeless Assessment Report.
The Department of Housing and Urban Development's 2024 Point-in-Time count found 771,480 Americans experiencing homelessness on a single January night. The current reading is the highest count in the site series.
HUD's Annual Homeless Assessment Report is built on a one-night census carried out by local Continuums of Care. The 2024 count is 771,480. That's up 18% from 653,104 a year earlier, and up 33% from the pre-pandemic 2020 reading. In absolute terms it is roughly the population of Seattle.
The single-night methodology is known to undercount. It misses people who couch-surf, who sleep in cars parked somewhere a surveyor won't walk, who cycle in and out of shelter across the year. The annualized count is substantially higher. The 771,480 count is the visible lower bound.
The drivers are not mysterious. Rents outpaced wages for the better part of a decade. Pandemic-era emergency rental assistance ran out. Medicaid CHIP Enrollment Monthly shows 15 million people losing coverage in the unwinding since April 2023 — a shock that tends to move through the system toward housing instability.
Homelessness is the terminal outcome of the distress cascade the American Distress Index tracks. The Buffer runs dry. The Safety Net fails. Falling Behind on rent becomes eviction. For 771,480 people, that cascade has already finished.
Explore Further
Is this happening to you?
Do you see more people experiencing homelessness in your community than you did a few years ago?
How has Annual Homelessness Assessment (PIT Count) changed over time?

Most affected counties
Counties with the highest safety net and buffer scores in the County Distress Index.
Explore all 3,144 counties →| Period | Value | YoY Change |
|---|---|---|
| 2024 | 771,480 | +118376.00 |
| 2023 | 653,104 | +70642.00 |
| 2022 | 582,462 | +1996.00 |
| 2021 | 580,466 | +0.00 |
| 2020 | 580,466 | +12466.00 |
| 2019 | 568,000 | +15170.00 |
| 2018 | 552,830 | −912.00 |
| 2017 | 553,742 | +3814.00 |
| 2016 | 549,928 | −14780.00 |
| 2015 | 564,708 | — |
Frequently Asked Questions
What is Annual Homelessness Assessment (PIT Count)?
Up from 653,104 a year ago; roughly the population of Seattle
Why does Annual Homelessness Assessment (PIT Count) matter for financial distress?
Annual Homelessness Assessment (PIT Count) is one of the indicators tracked by the American Distress Index (ADI), which measures five dimensions of U.S. household financial distress: Delinquency, Default & Legal, Debt Burden, Labor, and Safety Net & Buffer. Changes in this indicator contribute to the overall distress picture.
Where does the Annual Homelessness Assessment (PIT Count) data come from?
This data comes from HUD Annual Homeless Assessment Report. More information: https://www.huduser.gov/portal/datasets/ahar.html. The American Distress Index updates this indicator annual.

Quick poll
Is this affecting you or your household?
Discussion
Get the numbers when they move.
New data drops, indicator updates, and ADI score changes — delivered when it matters. No spam.
or Create an Account for full access
Loading comments…