The Pinch
Share of U.S. households reporting difficulty paying usual household expenses
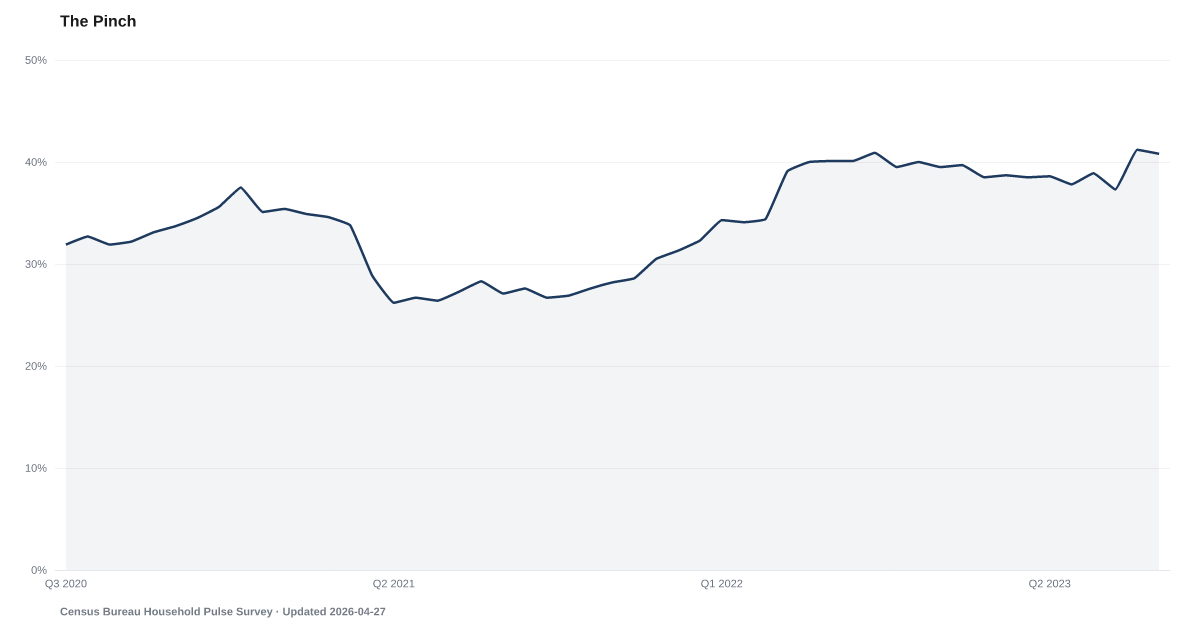
What is the current The Pinch?
37.1% of U.S. adults reported difficulty paying for usual household expenses in September 2024, according to the Census Bureau Household Pulse Survey. The share has held above 35% since June 2022, well above the 26% pandemic-era low recorded in April 2021. These are households squeezed by the gap between essential costs and income — groceries, rent, utilities, medical bills — not households behind on optional spending. Source: Census Bureau Household Pulse Survey.
The share of households reporting difficulty paying their usual expenses has stayed elevated since mid-2022 — the longest sustained stretch at that level since the survey began.
The Census Bureau's Household Pulse Survey, which has asked Americans about their ability to cover usual household expenses since 2020, shows 37.1% reporting difficulty as of September 2024. That's more than one in three households. It sits well above the 26.2% post-stimulus low recorded in April 2021.
The reading is not moving. It sits in the upper-30s month after month. What looks like stability on a chart is, in the lived economy, a plateau of strain. Headlines about falling inflation and a resilient labor market have not pulled this number down.
That gap is the point. Wages have been rising, nominally, while The Squeeze shows a sizeable share of households spending nearly all of their income on necessities. The paycheck grows. The bills grow faster. What's left is the pinch.
Buffer Depletion is a validated leading indicator in the American Distress Index — Buffer Depletion leads Debt Stress by 9 quarters with r = 0.69. When households report sustained difficulty covering usual expenses at this share, the delinquency and default data tend to follow. The Safety Net is already at a decade low, and The Buffer — the personal savings rate — is near historic lows. The pinch is the pressure before the crack.
Explore Further
How has The Pinch changed over time?

Most affected counties
Counties with the highest safety net and buffer scores in the County Distress Index.
Explore all 3,144 counties →| Period | Value | YoY Change |
|---|---|---|
| Sep 2024 | 37.1% | −0.2 pts |
| Aug 2024 | 37.4% | −1.5 pts |
| Jul 2024 | 37.4% | −0.4 pts |
| Jun 2024 | 37% | −1.6 pts |
| May 2024 | 36.5% | −2.0 pts |
| Apr 2024 | 36.4% | −2.1 pts |
| Apr 2024 | 35.7% | −3.0 pts |
| Mar 2024 | 36.2% | −2.3 pts |
| Feb 2024 | 36% | −3.7 pts |
| Oct 2023 | 40.8% | −0.1 pts |
| Oct 2023 | 41.2% | +1.1 pts |
| Sep 2023 | 37.3% | −2.8 pts |
Frequently Asked Questions
What share of Americans report difficulty paying usual household expenses?
37.1% of U.S. adults reported difficulty paying their usual household expenses in the latest Census Household Pulse Survey release (September 2024). The figure has held above 35% for most of 2023 and 2024, well above the 26% low recorded in April 2021 during peak pandemic-era support.
Is household-expense difficulty getting worse?
The share has plateaued rather than spiked, but at a structurally elevated level. Rates climbed from the 26% April 2021 low through 2022 as pandemic-era supports expired, crossed 35% in mid-2023, and have stayed there since. A stable 35%+ floor is itself evidence of persistent cost pressure on roughly one in three of U.S. households.
How does the Census Household Pulse Survey measure this?
Census Pulse is an experimental bi-weekly survey launched during the COVID-19 pandemic to track household economic conditions in near real time. It asks respondents directly about difficulty paying for usual household expenses including food, rent/mortgage, car payments, medical expenses, and student loans over the last seven days.
How does this connect to other distress indicators?
Reported difficulty paying expenses is a leading-edge signal. It registers stress earlier than delinquency rates (which require missed payments) and complements income-spending ratios like the Paycheck-to-Paycheck rate (BofA) that measure the same pressure from a different angle. When both measures sit at elevated levels simultaneously, the stress is structural rather than episodic.
Where does the Difficulty Paying Expenses data come from?
The U.S. Census Bureau's Household Pulse Survey, launched in April 2020 to measure the economic and social impacts of the COVID-19 pandemic. The survey is fielded in two-week cycles and the difficulty-paying-expenses question has been asked continuously since the first release. Data is released publicly at census.gov.

Quick poll
Is this affecting you or your household?
Discussion
Get the numbers when they move.
New data drops, indicator updates, and ADI score changes — delivered when it matters. No spam.
or Create an Account for full access
Loading comments…