Mississippi County Distress Index
Financial distress scores for all 82 counties in Mississippi, scored 0–100 across five domains. Mean score: 62.3. 32counties are in Serious Stress or Crisis.
Data: Census, BLS, Urban Institute, HUD, US Courts | Scores as of 2026-03-17
Mississippi Snapshot
Mississippi County Map
Loading interactive map…
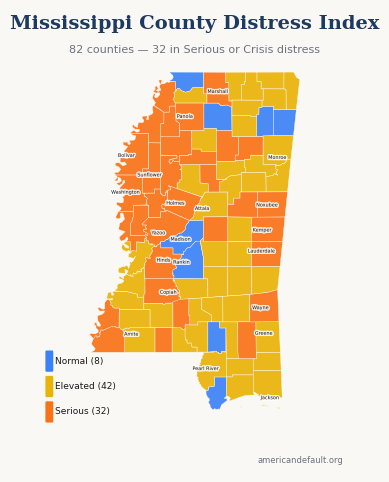
All 82 Mississippi counties colored by distress zone. Hover for details; click released counties for full reports.
Most & Least Distressed
Most Distressed
Least Distressed
Score Distribution
How Mississippi's 82 county scores are distributed across the 0–100 scale.
All Mississippi Counties
82 counties ranked by distress score. Click column headers to sort.
| State Rank | Nat'l Rank | County | Score | Zone | Primary Driver |
|---|---|---|---|---|---|
| 1 | 11 | Humphreys County | 79.0 | Serious Stress | Income & Poverty |
| 2 | 14 | Wilkinson County | 78.2 | Serious Stress | Income & Poverty |
| 3 | 15 | Washington County | 78.1 | Serious Stress | Income & Poverty |
| 4 | 18 | Holmes County | 77.8 | Serious Stress | Income & Poverty |
| 5 | 23 | Issaquena County | 77.4 | Serious Stress | Income & Poverty |
| 6 | 29 | Yazoo County | 77.1 | Serious Stress | Debt & Delinquency |
| 7 | 38 | Bolivar County | 76.5 | Serious Stress | Income & Poverty |
| 8 | 39 | Noxubee County | 76.5 | Serious Stress | Community Vulnerability |
| 9 | 50 | Sharkey County | 75.8 | Serious Stress | Income & Poverty |
| 10 | 64 | Tunica County | 75.2 | Serious Stress | Debt & Delinquency |
| 11 | 68 | Coahoma County | 74.9 | Serious Stress | Debt & Delinquency |
| 12 | 88 | Leflore County | 73.6 | Serious Stress | Income & Poverty |
| 13 | 128 | Marshall County | 72.1 | Serious Stress | Debt & Delinquency |
| 14 | 130 | Quitman County | 72.1 | Serious Stress | Income & Poverty |
| 15 | 192 | Panola County | 70.4 | Serious Stress | Debt & Delinquency |
| 16 | 226 | Pike County | 69.7 | Serious Stress | Income & Poverty |
| 17 | 236 | Kemper County | 69.5 | Serious Stress | Income & Poverty |
| 18 | 249 | Wayne County | 69.2 | Serious Stress | Community Vulnerability |
| 19 | 260 | Hinds County | 68.9 | Serious Stress | Debt & Delinquency |
| 20 | 310 | Adams County | 68.0 | Serious Stress | Debt & Delinquency |
| 21 | 332 | Montgomery County | 67.6 | Serious Stress | Debt & Delinquency |
| 22 | 347 | Sunflower County | 67.4 | Serious Stress | Income & Poverty |
| 23 | 353 | Tallahatchie County | 67.3 | Serious Stress | Debt & Delinquency |
| 24 | 406 | Lawrence County | 66.6 | Serious Stress | Community Vulnerability |
| 25 | 409 | Perry County | 66.5 | Serious Stress | Community Vulnerability |
| 26 | 426 | Chickasaw County | 66.2 | Serious Stress | Debt & Delinquency |
| 27 | 442 | Calhoun County | 66.0 | Serious Stress | Debt & Delinquency |
| 28 | 471 | Grenada County | 65.6 | Serious Stress | Community Vulnerability |
| 29 | 475 | Leake County | 65.5 | Serious Stress | Debt & Delinquency |
| 30 | 484 | Winston County | 65.2 | Serious Stress | Debt & Delinquency |
| 31 | 496 | Copiah County | 65.0 | Serious Stress | Debt & Delinquency |
| 32 | 498 | Lauderdale County | 65.0 | Serious Stress | Debt & Delinquency |
| 33 | 515 | Amite County | 64.7 | Elevated | Community Vulnerability |
| 34 | 522 | Claiborne County | 64.7 | Elevated | Income & Poverty |
| 35 | 534 | Harrison County | 64.5 | Elevated | Community Vulnerability |
| 36 | 575 | Clarke County | 63.8 | Elevated | Community Vulnerability |
| 37 | 578 | Jefferson Davis County | 63.7 | Elevated | Income & Poverty |
| 38 | 586 | Forrest County | 63.6 | Elevated | Housing Cost Burden |
| 39 | 629 | Greene County | 62.8 | Elevated | Community Vulnerability |
| 40 | 641 | Warren County | 62.6 | Elevated | Debt & Delinquency |
| 41 | 664 | Jefferson County | 62.4 | Elevated | Income & Poverty |
| 42 | 674 | Scott County | 62.2 | Elevated | Debt & Delinquency |
| 43 | 690 | Yalobusha County | 62.0 | Elevated | Debt & Delinquency |
| 44 | 719 | Neshoba County | 61.4 | Elevated | Debt & Delinquency |
| 45 | 729 | Jasper County | 61.4 | Elevated | Debt & Delinquency |
| 46 | 745 | Alcorn County | 61.1 | Elevated | Community Vulnerability |
| 47 | 755 | Benton County | 61.0 | Elevated | Debt & Delinquency |
| 48 | 767 | Oktibbeha County | 60.9 | Elevated | Debt & Delinquency |
| 49 | 793 | Pearl River County | 60.5 | Elevated | Community Vulnerability |
| 50 | 801 | Franklin County | 60.5 | Elevated | Debt & Delinquency |
| 51 | 820 | Tate County | 60.1 | Elevated | Debt & Delinquency |
| 52 | 831 | Simpson County | 60.0 | Elevated | Debt & Delinquency |
| 53 | 850 | Attala County | 59.7 | Elevated | Debt & Delinquency |
| 54 | 889 | Newton County | 59.2 | Elevated | Community Vulnerability |
| 55 | 932 | Tippah County | 58.6 | Elevated | Debt & Delinquency |
| 56 | 994 | Clay County | 58.0 | Elevated | Debt & Delinquency |
| 57 | 995 | Stone County | 57.9 | Elevated | Community Vulnerability |
| 58 | 997 | Jones County | 57.9 | Elevated | Debt & Delinquency |
| 59 | 1,032 | Choctaw County | 57.5 | Elevated | Debt & Delinquency |
| 60 | 1,066 | Walthall County | 57.2 | Elevated | Income & Poverty |
| 61 | 1,080 | Marion County | 57.0 | Elevated | Community Vulnerability |
| 62 | 1,164 | Tishomingo County | 55.7 | Elevated | Community Vulnerability |
| 63 | 1,167 | Carroll County | 55.7 | Elevated | Debt & Delinquency |
| 64 | 1,176 | Pontotoc County | 55.5 | Elevated | Debt & Delinquency |
| 65 | 1,180 | Webster County | 55.5 | Elevated | Community Vulnerability |
| 66 | 1,200 | George County | 55.1 | Elevated | Community Vulnerability |
| 67 | 1,211 | Lincoln County | 55.0 | Elevated | Debt & Delinquency |
| 68 | 1,229 | Jackson County | 54.8 | Elevated | Community Vulnerability |
| 69 | 1,301 | Prentiss County | 53.8 | Elevated | Debt & Delinquency |
| 70 | 1,319 | Lowndes County | 53.6 | Elevated | Debt & Delinquency |
| 71 | 1,384 | Covington County | 52.9 | Elevated | Income & Poverty |
| 72 | 1,410 | Smith County | 52.5 | Elevated | Community Vulnerability |
| 73 | 1,485 | Monroe County | 51.4 | Elevated | Debt & Delinquency |
| 74 | 1,488 | Union County | 51.3 | Elevated | Debt & Delinquency |
| 75 | 1,621 | Hancock County | 49.6 | Normal | Community Vulnerability |
| 76 | 1,739 | Lee County | 48.1 | Normal | Debt & Delinquency |
| 77 | 1,772 | Lamar County | 47.7 | Normal | Debt & Delinquency |
| 78 | 1,818 | Lafayette County | 47.1 | Normal | Housing Cost Burden |
| 79 | 1,996 | DeSoto County | 44.9 | Normal | Debt & Delinquency |
| 80 | 2,034 | Rankin County | 44.5 | Normal | Debt & Delinquency |
| 81 | 2,372 | Madison County | 39.6 | Normal | Debt & Delinquency |
| 82 | 2,382 | Itawamba County | 39.5 | Normal | Debt & Delinquency |
9 of 82 county reports for Mississippi are currently available. All 82 counties are scored and visible on the map above. New county reports are published weekly.
How County Scores Work
Each county is scored 0–100 using percentile-rank averaging across five data domains: Debt & Delinquency, Income & Poverty, Housing Cost Burden, Employment & Wages, and Community Vulnerability. A score of 50 means the county falls at the national median. Higher scores indicate greater financial distress.