Underwater Mortgages (Owing More Than the Home Is Worth)
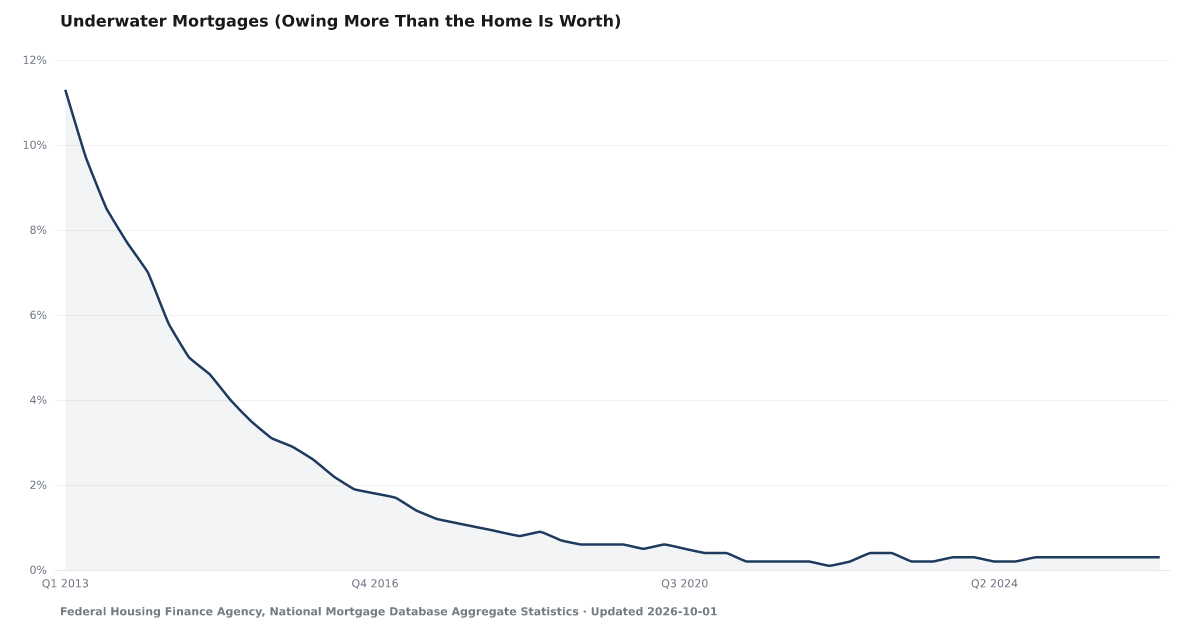
Share of outstanding first mortgages owing more than the home is estimated to be worth, by quarter
What is the current Underwater Mortgages (Owing More Than the Home Is Worth) reading?
0.3% of outstanding first mortgages were underwater at the end of Q2 2026, the same as a year earlier. A mortgage is underwater when it owes more than the home is estimated to be worth. The share counts first mortgages only and uses the Federal Housing Finance Agency's estimate of home values. Source: Federal Housing Finance Agency, National Mortgage Database Aggregate Statistics.
Measurement basis: Share of outstanding first mortgages, by number of loans, whose estimated current loan-to-value ratio is above 100 percent, so the balance owed is more than the home's estimated value (negative equity). FHFA publishes it directly in its Outstanding Residential Mortgage Statistics (All Mortgages, national, PCT_MTMLTV_GT100) as of each quarter's end, rounded to a tenth of a percentage point. The home's current value is FHFA's estimate: its value at origination updated with FHFA's house price index for the area. First mortgages only, not second liens or home equity lines. It covers the mortgages in FHFA's National Mortgage Database, a nationally representative 1-in-20 sample of closed-end first mortgages reported to the credit bureaus; mortgages on investor-owned homes and manufactured homes are not as well represented. If FHFA restates a published quarter, we log the new figure for review and keep the published one.
This product uses FHFA data but is neither endorsed nor certified by FHFA.
0.3% of outstanding first mortgages owed more than the home was estimated to be worth at the end of Q2 2026, the same as a year earlier.
A mortgage is underwater when the balance owed is more than the home is worth. The Federal Housing Finance Agency (FHFA), which oversees Fannie Mae and Freddie Mac, estimates each home's current value for the mortgages in its National Mortgage Database. At the end of Q2 2026, 0.3% of outstanding first mortgages were underwater, the same as a year earlier.
If the owner sold an underwater home, the sale would not pay off the loan, and the owner would need to bring cash to close it. These mortgages are part of the larger group with less than 10 percent equity, shown in Mortgages With Less Than 10 Percent Equity.
FHFA does not appraise each home. It takes the home's value when the loan was made and updates it with its house price index for the area, so the value is an estimate and can miss for any one home. The count is of first mortgages only, so a home with a second mortgage or a home equity line can owe more than this share shows. It covers the mortgages in FHFA's National Mortgage Database (NMDB®), a random one-in-20 sample of closed-end first mortgages reported to the credit bureaus. Mortgages on investor-owned homes and manufactured homes are not as well represented in that sample.
FHFA publishes this share once a quarter, rounded to a tenth of a percentage point, and gives no release calendar. If FHFA restates a quarter we have published, we log the new figure for review and keep the published one.
Explore Further
Underwater Mortgages (Owing More Than the Home Is Worth) over time: what has changed?

Counties with the highest safety net and buffer scores
These are safety net and buffer scores from our County Distress Index, not county readings of Underwater Mortgages (Owing More Than the Home Is Worth).
Explore all 3,144 counties →| Period | Value | YoY Change |
|---|---|---|
| Q2 2026 | 0.3% | 0 pp |
| Q1 2026 | 0.3% | 0 pp |
| Q4 2025 | 0.3% | 0 pp |
| Q3 2025 | 0.3% | +0.1 pp |
| Q2 2025 | 0.3% | +0.1 pp |
| Q1 2025 | 0.3% | 0 pp |
| Q4 2024 | 0.3% | 0 pp |
| Q3 2024 | 0.2% | 0 pp |
| Q2 2024 | 0.2% | 0 pp |
| Q1 2024 | 0.3% | -0.1 pp |
| Q4 2023 | 0.3% | -0.1 pp |
| Q3 2023 | 0.2% | 0 pp |
Frequently Asked Questions
What does underwater mean for a mortgage?
The mortgage balance is more than the home is estimated to be worth, so the owner has negative equity. A sale would not pay off the loan.
How can FHFA tell a home is underwater without an appraisal?
FHFA takes the home's value when the loan was made and updates it with its house price index for the area, so each value is an estimate. The estimate can miss for any one home.
Does this count second mortgages or home equity lines?
No. It counts first mortgages only. A home with a second mortgage or a home equity line can owe more than this share shows.
Does this cover every mortgage?
It covers the mortgages in FHFA's National Mortgage Database, a random one-in-20 sample of closed-end first mortgages reported to the credit bureaus. FHFA describes the sample as representative of the mortgage market as a whole. Mortgages on investor-owned homes and manufactured homes are not as well represented.
Where does this data come from?
The Federal Housing Finance Agency's National Mortgage Database Aggregate Statistics, in its Outstanding Residential Mortgage Statistics file, which FHFA publishes once a quarter. We read the file directly, with no manual entry.

Quick poll
Is this affecting you or your household?
Discussion
Get the numbers when they move.
New data drops, indicator updates, and American Distress Index changes — delivered when it matters. No spam.
or Create an Account for full access
Loading comments…