The Skip Rate
Up from 16.7% a year ago, skipping bills to make ends meet
What is the current The Skip Rate?
The share of adults skipping bill payments — utilities, medical bills, minimum loan payments — is a behavioral measure of acute financial distress that captures households actively falling behind on obligations in real time. This metric draws from the Philadelphia Fed's Consumer Finance Institute survey data. Source: Philadelphia Fed Consumer Finance Institute.
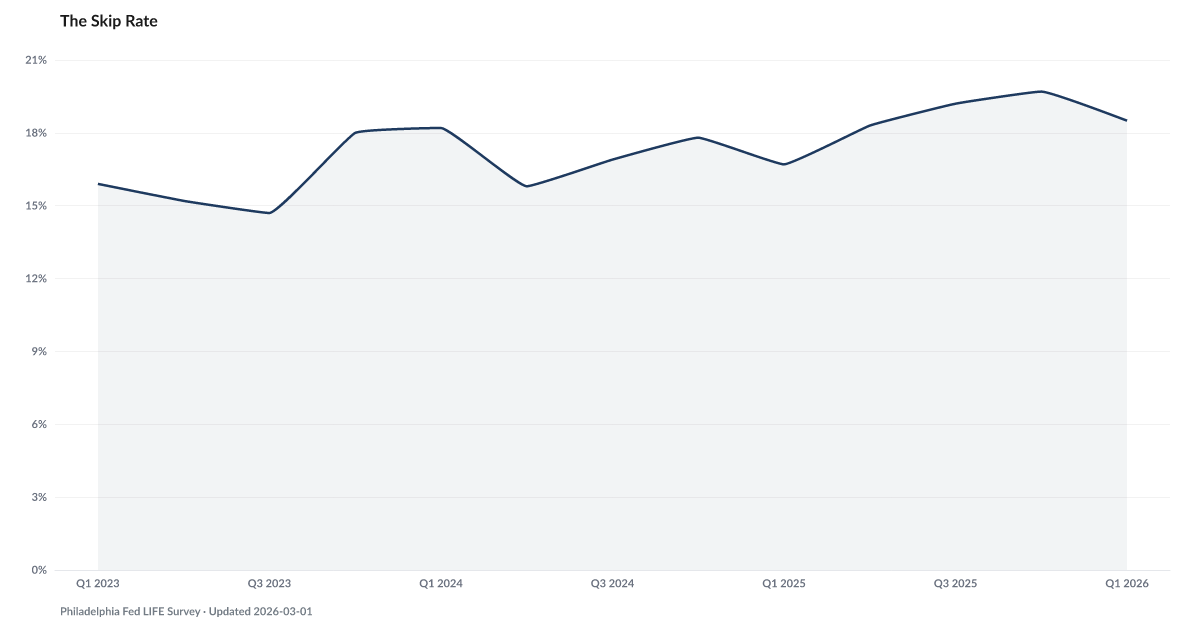
The share of adults who skipped at least one bill payment in the past quarter has sat above 14% across every reading since the Philadelphia Fed began tracking the question in 2023. The Q1 2026 reading is 18.5%.
The Philadelphia Fed's LIFE Survey, a quarterly household finance survey launched in 2023, has never recorded a reading below 14.7%. The most recent quarter clocks 18.5% — well above pre-pandemic baselines for similar bill-skip surveys, and within the elevated band the series has held since the question was first asked.
Skipping a bill is not the same as being unable to pay one. People triage. Rent over the electric bill. The electric bill over the credit card. The credit card over the medical bill. What the skip rate captures is the share of households running that triage calculation in real time.
Roughly one in five adults is doing it. That has held across the series, through a period when headline unemployment stayed low and GDP kept growing.
The behavior sits upstream of what shows on credit reports. A skipped utility bill may not report to the bureaus for months. A missed credit card payment becomes Falling Behind. A missed mortgage payment becomes a delinquency, then a foreclosure filing. The skip rate is the early-warning layer — the choices The Buffer is too thin to cushion and The Safety Net is too shallow to absorb.
Explore Further
How has The Skip Rate changed over time?

Most affected counties
Counties with the highest safety net and buffer scores in the County Distress Index.
Explore all 3,144 counties →| Period | Value | YoY Change |
|---|---|---|
| Q1 2026 | 18.5% | +1.8 pts |
| Q4 2025 | 19.7% | +1.9 pts |
| Q3 2025 | 19.2% | +2.3 pts |
| Q2 2025 | 18.3% | +2.5 pts |
| Q1 2025 | 16.7% | −1.5 pts |
| Q4 2024 | 17.8% | −0.2 pts |
| Q3 2024 | 16.9% | +2.2 pts |
| Q2 2024 | 15.8% | +0.6 pts |
| Q1 2024 | 18.2% | +2.3 pts |
| Q4 2023 | 18% | — |
| Q3 2023 | 14.7% | — |
| Q2 2023 | 15.2% | — |
Frequently Asked Questions
What does the skip rate measure?
It measures the share of adults who report skipping or being unable to make required bill payments — including utilities, medical bills, and minimum loan payments — in the previous month. This is a behavioral rather than credit-report-based measure of financial distress.
Why is skipping bills significant?
Skipping bill payments is one of the first observable behaviors of financial distress, often preceding formal delinquency on credit accounts. It indicates that households are making triage decisions about which obligations to pay and which to defer.
Where does the skip rate data come from?
The Philadelphia Fed's Consumer Finance Institute surveys household financial behavior, including bill payment difficulties. This provides a real-time complement to credit-report-based delinquency measures, capturing distress that may not yet appear in bank call reports.

Quick poll
Is this affecting you or your household?
Discussion
Get the numbers when they move.
New data drops, indicator updates, and ADI score changes — delivered when it matters. No spam.
or Create an Account for full access
Loading comments…