The Other Banks
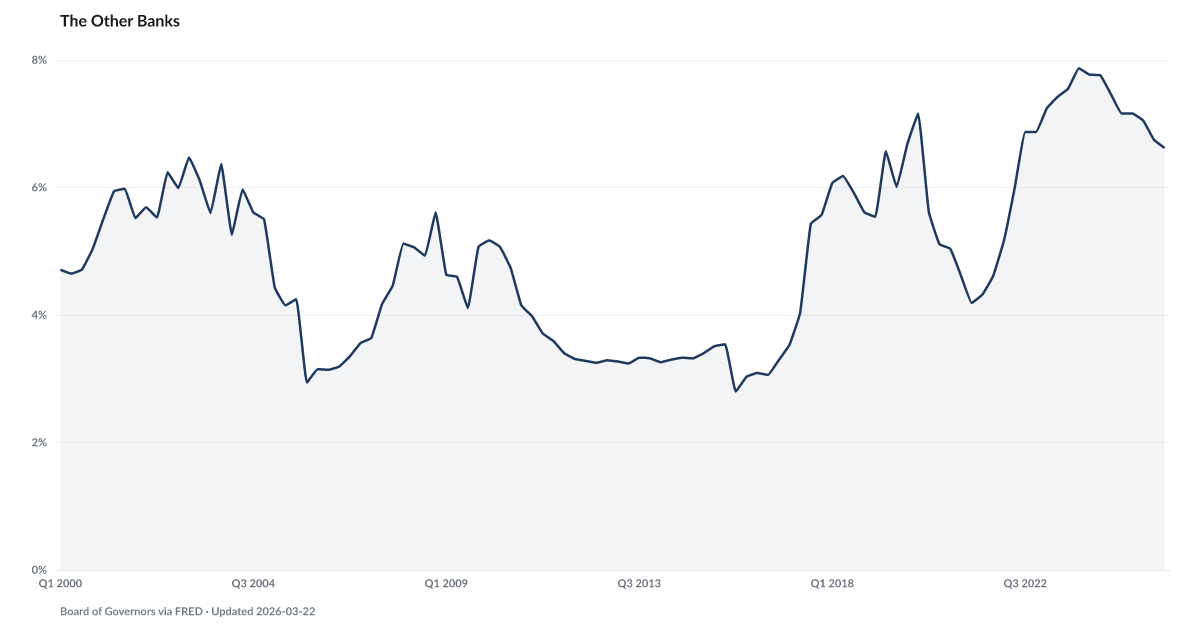
Share of credit card loan balances delinquent or in nonaccrual status
Historically follows Delinquency Rate on Consumer Loans (ex credit card) by 13 quarters — no active signal. Delinquency Rate on Consumer Loans (ex credit card) · View projections
What is the current Other Banks reading?
Credit card delinquency at commercial banks outside the 100 largest by assets stood at 6.43% in Q1 2026, according to Board of Governors of the Federal Reserve System series DRCCLOBS. The measure is the share of credit card loan balances that are 30 or more days past due or in nonaccrual status. In a separately matched comparison, the outside-top-100 minus top-100 spread was 3.75 percentage points in Q2 2026. Source: Federal Reserve Board data retrieved via FRED.
Measurement basis: 30+ days past due or in nonaccrual status, per the Federal Reserve Board Charge-Off and Delinquency Rates release
The Federal Reserve reports credit card delinquency separately for commercial banks outside the 100 largest by assets.
Credit card delinquency at commercial banks outside the 100 largest by assets stood at 6.43% in Q1 2026, according to the Federal Reserve Board series DRCCLOBS. The rate measures credit card loan balances that are 30 or more days past due or in nonaccrual status.
Plastic Ceiling reports total credit card debt, while The Card Tax reports an average interest rate. Those are separate measurements and do not identify the customers or pricing represented by DRCCLOBS.
For a direct bank-size comparison, the outside-top-100 minus top-100 spread uses DRCCLOBS and DRCCLT100S from one matched quarter and FRED realtime vintage. Falling Behind is the all-commercial-bank aggregate and is not a substitute for the top-100 series.
Explore Further
Is this happening to you?
Do you carry a credit card balance from month to month?
How has The Other Banks changed over time?

Most affected counties
Counties with the highest delinquency scores in the County Distress Index.
Explore all 3,144 counties →| Period | Value | YoY Change |
|---|---|---|
| Q1 2026 | 6.43% | -0.75 pp |
| Q4 2025 | 6.6% | -0.54 pp |
| Q3 2025 | 6.74% | -0.71 pp |
| Q2 2025 | 7.06% | -0.71 pp |
| Q1 2025 | 7.18% | -0.61 pp |
| Q4 2024 | 7.14% | -0.72 pp |
| Q3 2024 | 7.45% | -0.1 pp |
| Q2 2024 | 7.77% | +0.34 pp |
| Q1 2024 | 7.79% | +0.55 pp |
| Q4 2023 | 7.86% | +0.99 pp |
| Q3 2023 | 7.55% | +0.68 pp |
| Q2 2023 | 7.43% | +1.44 pp |
Frequently Asked Questions
How does credit card delinquency outside the top 100 compare with the top 100?
The direct comparison is DRCCLOBS minus DRCCLT100S at one matched quarter and FRED realtime vintage. That spread was 3.75 percentage points in Q2 2026. A positive value means the outside-top-100 rate was higher; a negative value means it was lower.
What does the outside-top-100 rate measure?
DRCCLOBS measures the percentage of credit card loan balances at commercial banks outside the 100 largest by assets that are 30 or more days past due or in nonaccrual status. It is not a count or percentage of people.
Is the all-commercial-bank rate the top-100-bank rate?
No. DRCCLACBS covers all commercial banks, including the banks outside the top 100. The top-100 comparison uses DRCCLT100S directly.
Does the spread explain why the rates differ?
No. The spread is arithmetic over two population-specific Federal Reserve series. It does not identify customer characteristics, lending practices, or institutional finances.
Where does the bank-size delinquency data come from?
The Federal Reserve Board publishes seasonally adjusted, end-of-quarter delinquency rates for banks ranked 1st through 100th by assets and for banks outside that group. FRED distributes the series as DRCCLT100S and DRCCLOBS.


Quick poll
Is this affecting you or your household?
Discussion
Get the numbers when they move.
New data drops, indicator updates, and ADI score changes — delivered when it matters. No spam.
or Create an Account for full access
Loading comments…